

Review
doi: 10.1016/S0896-1549(03)00102-0.
Imaging in glaucoma
Affiliations
- PMID: 15102512
- PMCID: PMC1941654
- DOI: 10.1016/S0896-1549(03)00102-0
Item in Clipboard
Review
Imaging in glaucoma
Ophthalmol Clin North Am.
2004 Mar.
Abstract
Structural assessment using the imaging technologies discussed herein provides reproducible quantitative measurements of posterior segment ocular structures. These measurements have been found to provide useful data for glaucoma detection in various regions of the posterior segment. Further studies are needed to evaluate the utility of these technologies for pre-perimetric glaucoma detection and for monitoring glaucoma progression over an extended period.
Figures
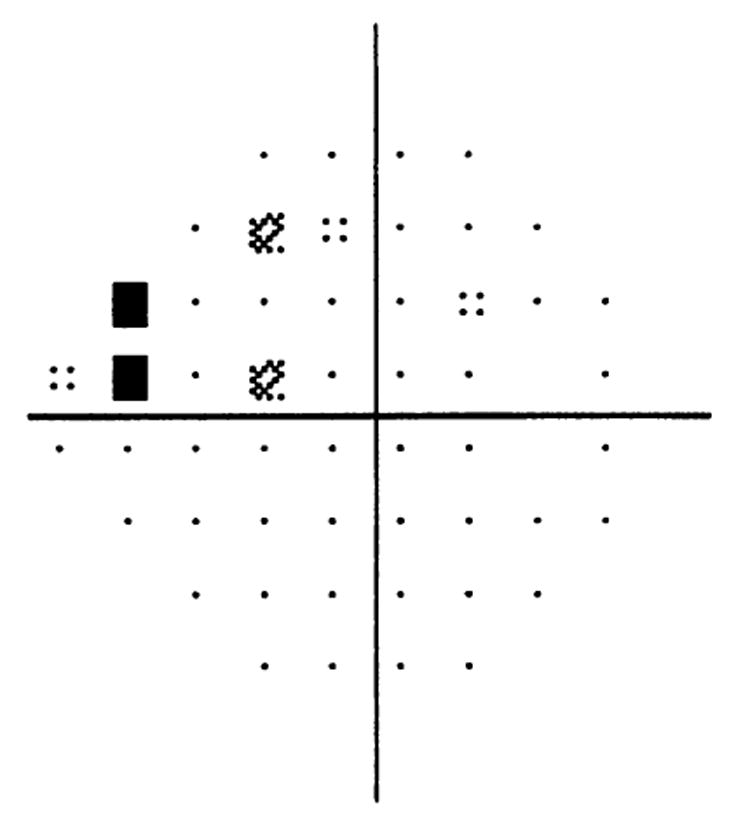
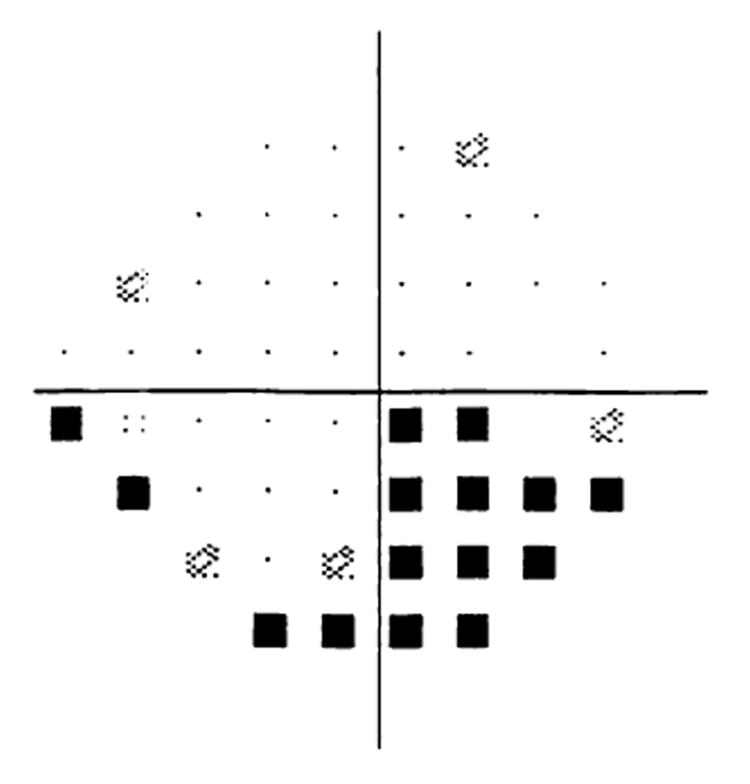
Visual field test of patient with glaucoma (OD). Visual field shows a superior nasal defect and questionable superior arcuate defect. This field corresponds to the later figures showing HRT and OCT scans of this patient.
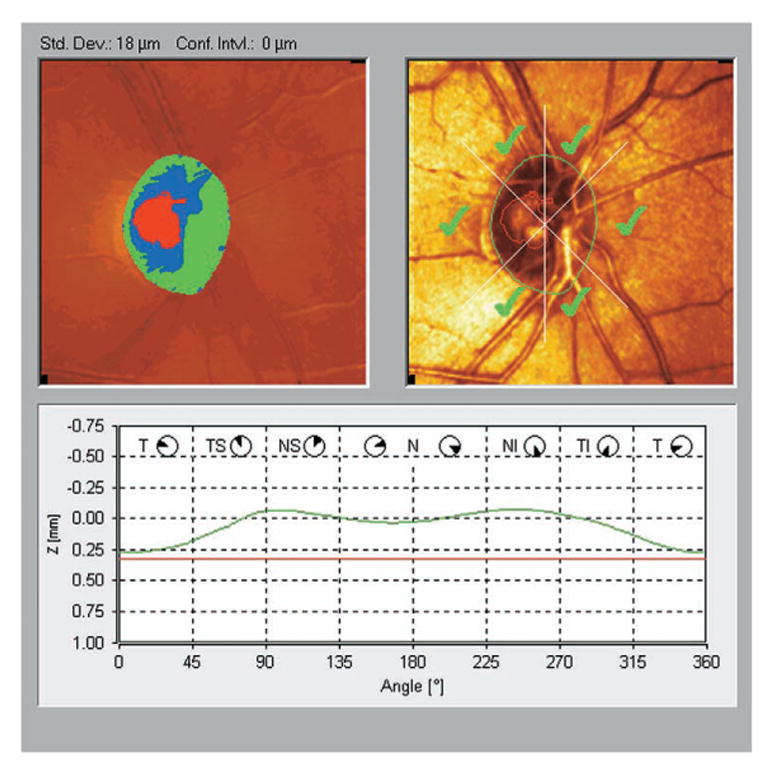
HRT scan of normal subject (OD). On the upper left image, the topographic ONH map is shown. The red area marks the cup, and the green and blue areas mark the neuroretinal rim. The upper right image, the reflectance image, is shown with the tracing (green) of the optic disk margin and the outline (red) of the optic cup. All of the ONH sectors are marked with the green checkmark, signifying that they are within the normal limits based on Moorfields regression analysis. At the bottom of the figure, a graph depicts the surface height along the contour line on the ONH margin. Note the normal “double-hump” appearance, with higher thickness in the superior and inferior regions.
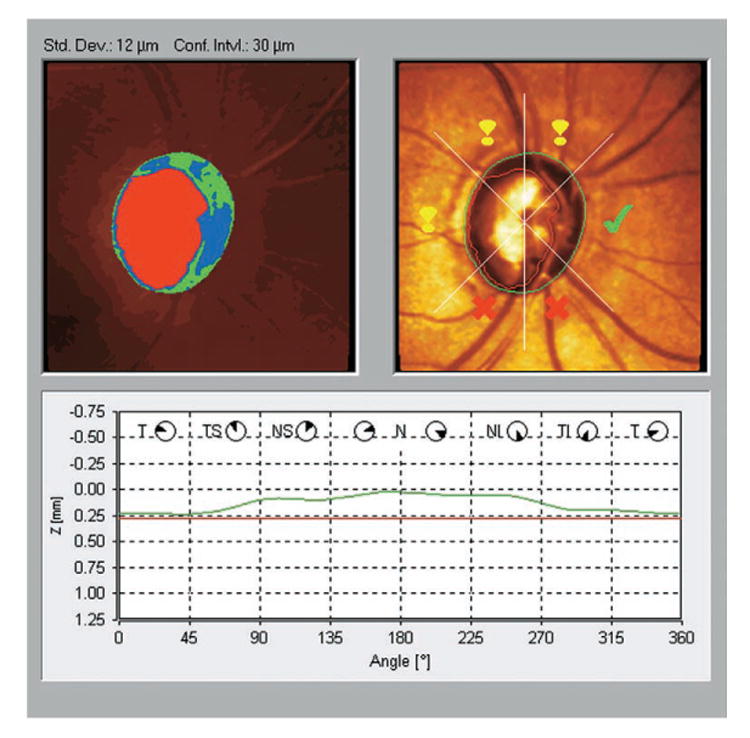
HRT scan of subject with glaucoma (OD). On the upper left image, note the extensive cupping of the ONH and the thinnest area of neuroretinal rim in the inferotemporal region. Moorfields regression analysis marked the inferotemporal and the nasal inferior sectors as abnormal and the temporal and the superior sectors as borderline. The typical double-hump configuration in the lower graph was eliminated mainly owing to tissue loss at the ONH poles. These findings correspond with the superior nasal visual field defect shown in Fig. 1 and show additional superior ONH damage that might precede the perimetric appearance.
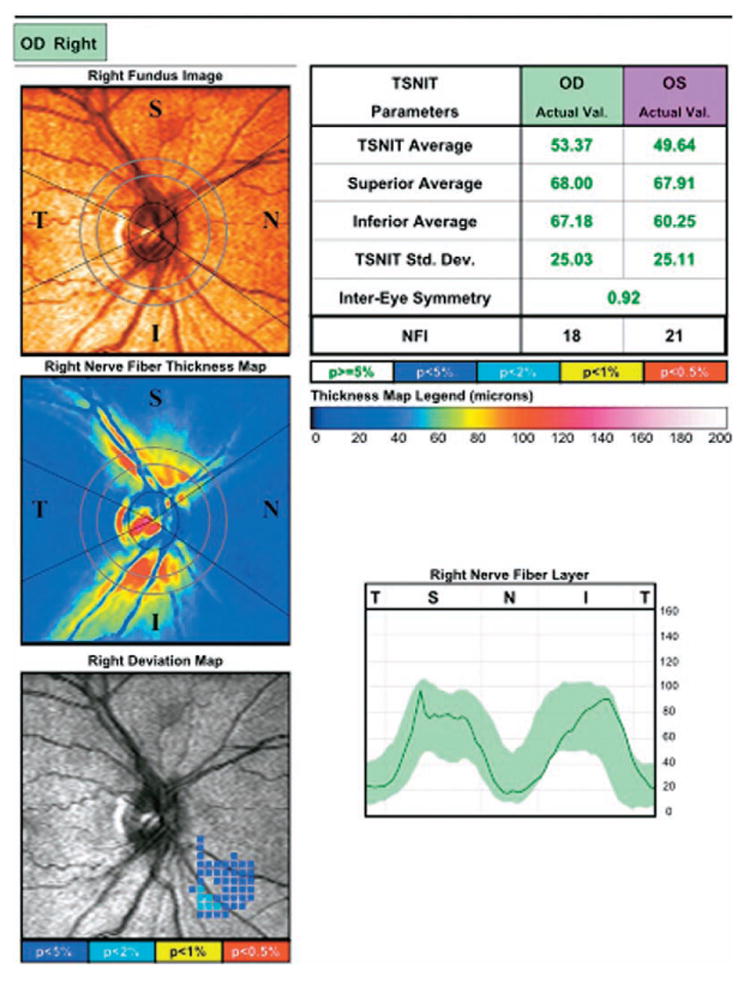
GDx VCC scan of normal subject (OD). This figure shows the fundus image (top left), a pseudocolor representation of the nerve fiber layer thickness (middle left), and a map of areas that deviate from normal thickness values (bottom left). The nerve fiber layer graph shows measured thickness values (green line) superimposed on the normative range (green band).
Visual field test of subject with glaucoma (OD). Visual field shows an inferior hemifield defect. This field corresponds to the following figure showing a GDx VCC scan of a glaucomatous subject.
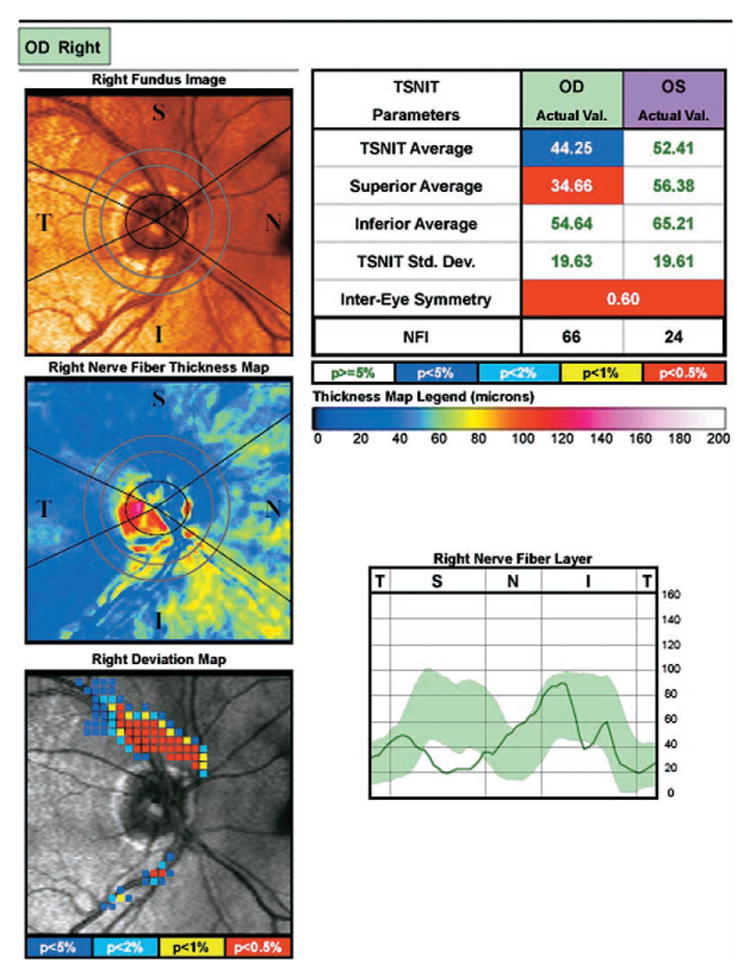
GDx VCC scan of subject with glaucoma (OD). Note the blue shaded area in the superior region of the thickness map that signifies a relatively thin nerve fiber layer. This thinning of the superior region is highlighted in the deviation map and the nerve fiber layer graph showing thickness values outside of the norm in the superior region. This defect corresponds well with this subject's visual field as shown in Fig. 5.
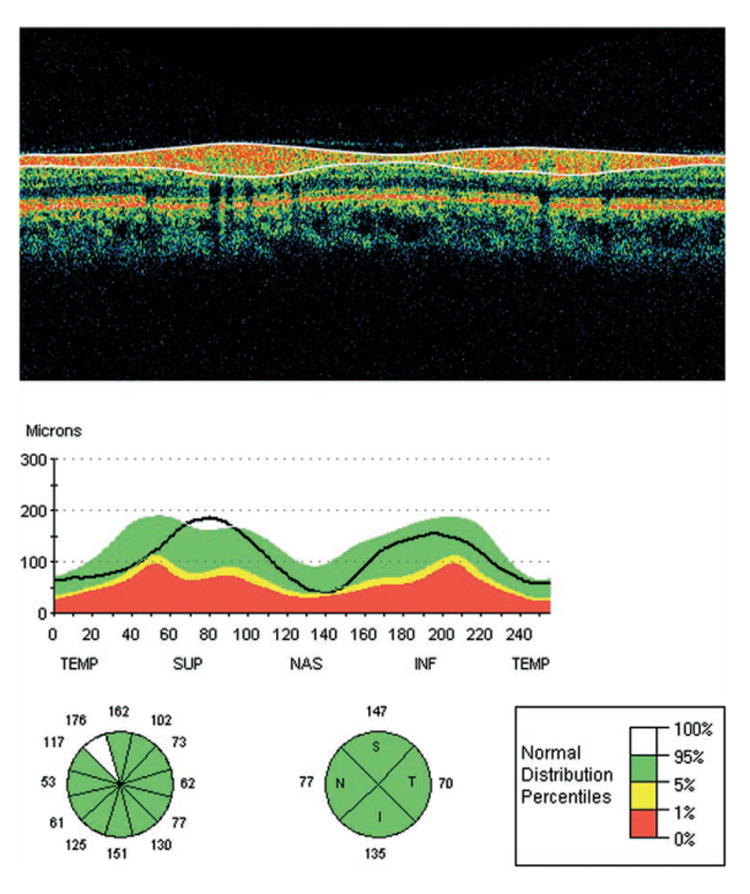
OCT retinal nerve fiber layer thickness of a normal subject. At the top of the figure, a color-coded cross-sectional map displays 256 adjacent A-scans. The uppermost red layer delineated with the white lines is the nerve fiber layer. Below this image, a graph shows the patient's nerve fiber layer thickness values (black line) in comparison with normative values. The circular charts show average nerve fiber layer thickness values for the depicted regions, and the colors denote the correspondence with the normative database.
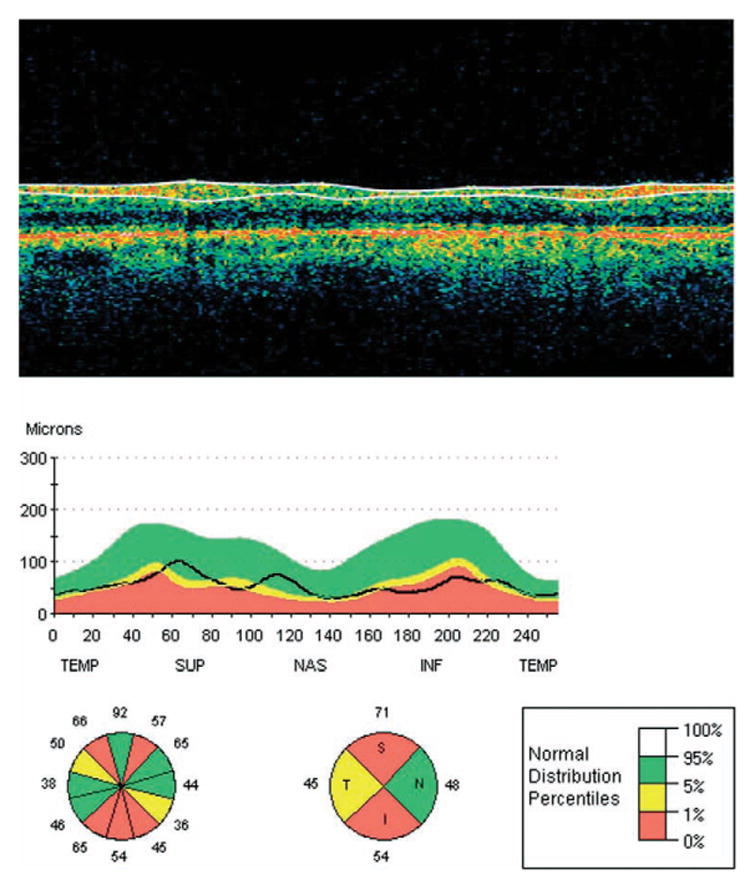
OCT retinal nerve fiber layer thickness of a subject with glaucoma. The cross-sectional map shows diminution of the nerve fiber layer when compared with the normal thickness. The thinning is pronounced for the most part in the inferior sectors corresponding to the visual field defect shown in Fig. 1. Abnormal thinning is also evident in the upper sectors, possibly reflecting structural damage not yet evident by perimetry.

OCT macular map of a normal subject (OS). The uppermost image of the figure is a color-coded, cross-sectional map along the vertical line, one of the six radial scans that compose the macular map. The central thinning corresponds to the foveola, and the white lines mark the vitreoretinal and the retinal pigment epithelium boundaries of the retina. The lower left map is the color-coded macular thickness map wherein blue signifies thinner retina and yellow-green thicker retina. The center map gives the quantitative measurements in nine sectors.
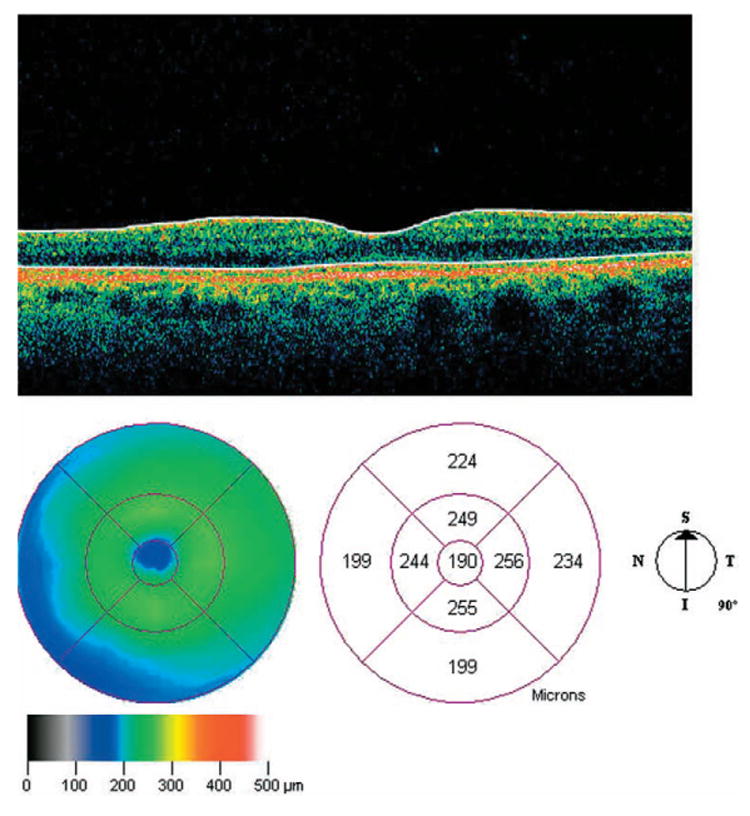
OCT macular map of a subject with glaucoma (OD). The uppermost image shows a marked diminution of the upper red band, signifying damage to the nerve fiber layer. The color-coded map (lower left) demonstrates a thinning of the macula, most extensively in the inferotemporal region, which corresponds to the visual field defect shown in Fig. 1. This finding also can be appreciated from the numerical values in the lower center map.
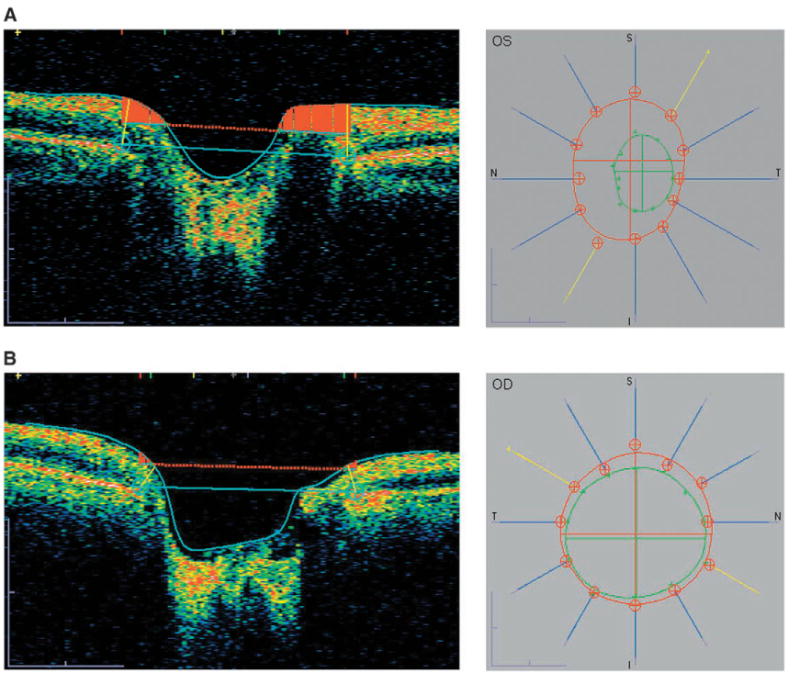
(A) OCT analysis of the ONH of a normal subject (OS). The image on the left is a inferonasal to superotemporal optical cross-section map, one of the six radial scans that compose the ONH map. The edge of the retinal pigment epithelium/choriocapillaris layer is marked by the blue cross, and a straight line connects between the margins. A parallel line located anteriorly to this line separates the rim (above the line) and the cup (below the line). On the right, the contours of the ONH (red circle) and optic cup (green circle) are displayed as created from the data obtained from all six radial scans (blue lines; yellow line represents the scan depicted in the image on the left). (B) OCT analysis of the ONH of a subject with glaucoma (OD). Note the widened optic cup and increased slope of the contour of the rim in the image on the left, representing axonal loss in the optic cup of a glaucomatous patient. The contour map on the right demonstrates a large cup, with thinning of the neuroretinal rim most pronounced in the inferotemporal region, which corresponds to the visual field defects in this patient (see Fig. 1).
Similar articles
-
Detection of glaucoma by spectral domain-scanning laser ophthalmoscopy/optical coherence tomography (SD-SLO/OCT) and time domain optical coherence tomography.J Glaucoma. 2011 Jan;20(1):15-20. doi: 10.1097/IJG.0b013e3181d1d332. J Glaucoma. 2011. PMID: 20436370
-
Role of imaging in glaucoma diagnosis and follow-up.Indian J Ophthalmol. 2011 Jan;59 Suppl(Suppl1):S59-68. doi: 10.4103/0301-4738.73696. Indian J Ophthalmol. 2011. PMID: 21150036 Free PMC article.
-
Advanced imaging for glaucoma study: design, baseline characteristics, and inter-site comparison.Am J Ophthalmol. 2015 Feb;159(2):393-403.e2. doi: 10.1016/j.ajo.2014.11.010. Epub 2014 Nov 8. Am J Ophthalmol. 2015. PMID: 25447111 Free PMC article.
-
Role of optic nerve imaging in glaucoma clinical practice and clinical trials.Am J Ophthalmol. 2008 Apr;145(4):598-603. doi: 10.1016/j.ajo.2007.12.018. Epub 2008 Mar 4. Am J Ophthalmol. 2008. PMID: 18295183 Free PMC article. Review.
-
Imaging of the retinal nerve fibre layer for glaucoma.Br J Ophthalmol. 2009 Feb;93(2):139-43. doi: 10.1136/bjo.2008.145540. Epub 2008 Nov 21. Br J Ophthalmol. 2009. PMID: 19028735 Free PMC article. Review.
Cited by
-
Comparison of optical coherence tomography and scanning laser polarimetry measurements in patients with multiple sclerosis.Optom Vis Sci. 2010 Aug;87(8):576-84. doi: 10.1097/OPX.0b013e3181e3dcb3. Optom Vis Sci. 2010. PMID: 20495500 Free PMC article.
-
Variation in optical coherence tomography signal quality as an indicator of retinal nerve fibre layer segmentation error.Br J Ophthalmol. 2012 Apr;96(4):514-8. doi: 10.1136/bjophthalmol-2011-300044. Epub 2011 Sep 6. Br J Ophthalmol. 2012. PMID: 21900227 Free PMC article. Clinical Trial.
-
Correlations between retinal nerve fiber layer and visual field in eyes with nonarteritic anterior ischemic optic neuropathy.Am J Ophthalmol. 2007 Feb;143(2):288-294. doi: 10.1016/j.ajo.2006.09.045. Epub 2006 Oct 19. Am J Ophthalmol. 2007. PMID: 17157797 Free PMC article.
-
A method to detect progression of glaucoma using the multifocal visual evoked potential technique.Doc Ophthalmol. 2009 Apr;118(2):139-50. doi: 10.1007/s10633-008-9149-2. Epub 2008 Sep 25. Doc Ophthalmol. 2009. PMID: 18830654 Free PMC article.
-
The effect of acute intraocular pressure elevation on peripapillary retinal thickness, retinal nerve fiber layer thickness, and retardance.Invest Ophthalmol Vis Sci. 2009 Oct;50(10):4719-26. doi: 10.1167/iovs.08-3289. Epub 2009 May 6. Invest Ophthalmol Vis Sci. 2009. PMID: 19420342 Free PMC article.
References
-
- Leske MC, Heijl A, Hussein M, et al. Factors for glaucoma progression and the effect of treatment: the early manifest glaucoma trial. Arch Ophthalmol. 2003;121(1):48–56. - PubMed
-
- Goldberg I. Relationship between intraocular pressure and preservation of visual field in glaucoma. Surv Ophthalmol. 2003;48:S3–7. - PubMed
-
- The Advanced Glaucoma Intervention Study (AGIS); 7. The relationship between control of intraocular pressure and visual field deterioration. The AGIS Investigators. Am J Ophthalmol. 2000;130(4):429–40. - PubMed
Publication types
MeSH terms
Grants and funding
LinkOut - more resources
Full Text Sources
Other Literature Sources
Medical
