

Modelling plant responses to elevated CO2: how important is leaf area index?
- PMID: 15102613
- PMCID: PMC4242306
- DOI: 10.1093/aob/mch101
Modelling plant responses to elevated CO2: how important is leaf area index?
Abstract
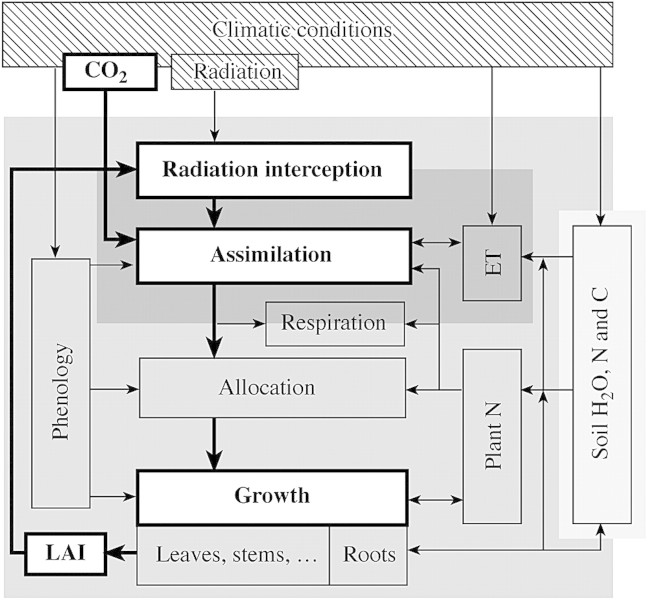
Background and aims: The problem of increasing CO(2) concentration [CO(2)] and associated climate change has generated much interest in modelling effects of [CO(2)] on plants. While variation in growth and productivity is closely related to the amount of intercepted radiation, largely determined by leaf area index (LAI), effects of elevated [CO(2)] on growth are primarily via stimulation of leaf photosynthesis. Variability in LAI depends on climatic and growing conditions including [CO(2)] concentration and can be high, as is known for agricultural crops which are specifically emphasized in this report. However, modelling photosynthesis has received much attention and photosynthesis is often represented inadequately detailed in plant productivity models. Less emphasis has been placed on the modelling of leaf area dynamics, and relationships between plant growth, elevated [CO(2)] and LAI are not well understood. This Botanical Briefing aims at clarifying the relative importance of LAI for canopy assimilation and growth in biomass under conditions of rising [CO(2)] and discusses related implications for process-based modelling.
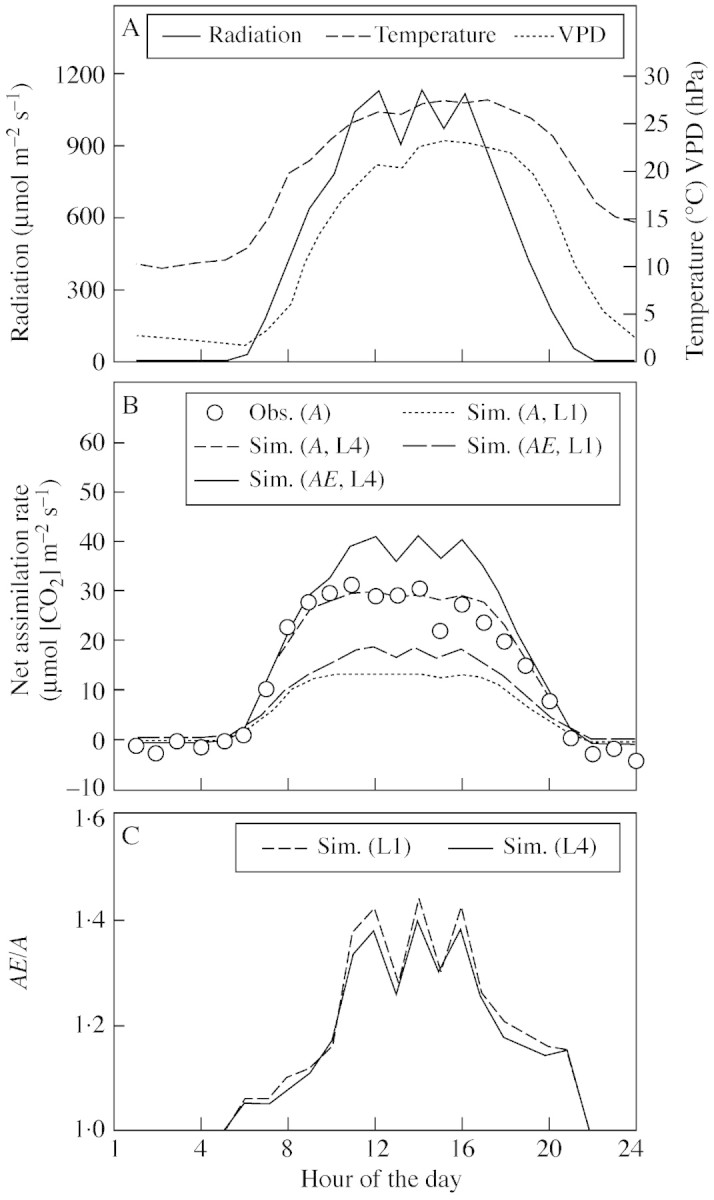
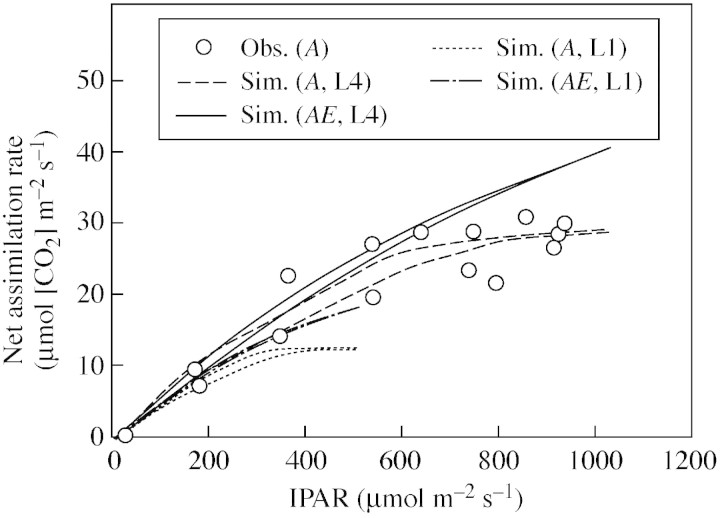
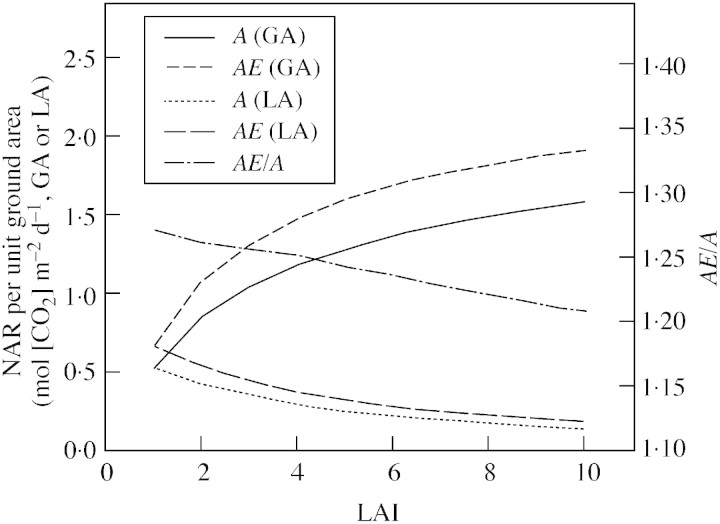
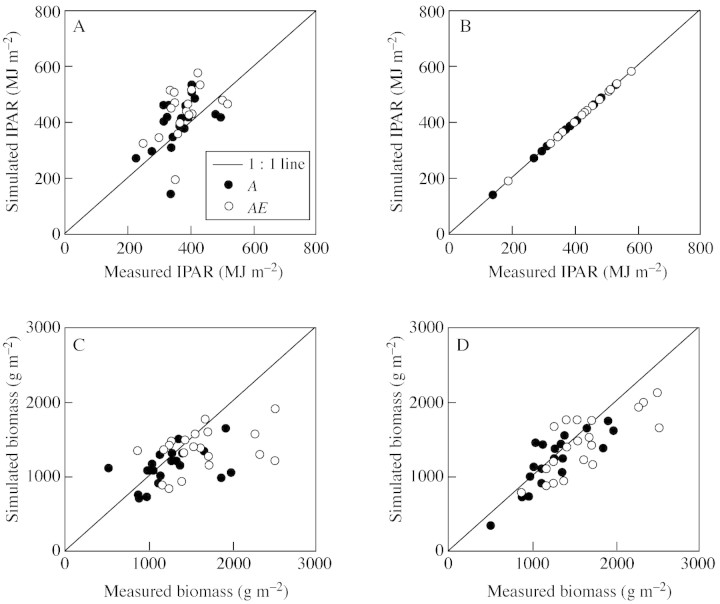
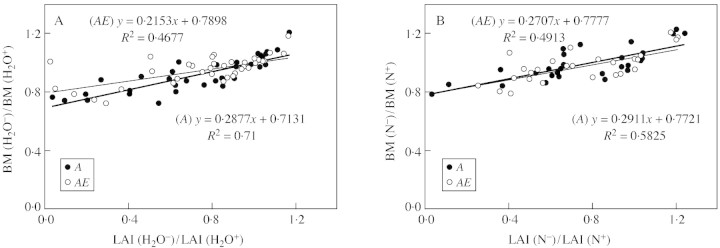
Model: A simulation exercise performed for a wheat crop demonstrates recent experimental findings about canopy assimilation as affected by LAI and elevation of [CO(2)]. While canopy assimilation largely increases with LAI below canopy light saturation, effects on canopy assimilation of [CO(2)] elevation are less pronounced and tend to decline as LAI increases. Results from selected model-testing studies indicate that simulation of LAI is often critical and forms an important source of uncertainty in plant productivity models, particularly under conditions of limited resource supply.
Conclusions: Progress in estimating plant growth and productivity under rising [CO(2)] is unlikely to be achieved without improving the modelling of LAI. This will depend on better understanding of the processes of substrate allocation, leaf area development and senescence, and the role of LAI in controlling plant adaptation to environmental changes.
Figures
References
-
- AllenTFH, Starr TB.1982.Hierarchy: perspectives for ecological complexity. Chicago: University of Chicago Press.
-
- AmthorJS, Loomis RS.1996. Integrating knowledge of crop responses to elevated CO2 and temperature with mechanistic simulation models: model components and research needs. In: Koch GW, Mooney HA, eds. Carbon Dioxide and Terrestrial Ecosystems. San Diego: Academic Press, 317–345.
-
- AntenNPR, Schieving F, Medina E, Werger MJA, Schuffelen P.1995. Optimal leaf area indices in C3 and C4 mono‐ and dicotyledonous species at low and high nitrogen availability. Physiologia Plantarum 95: 541–550.
-
- BadeckFW.1995. Intra‐leaf gradient of assimilation rate and optimal allocation of canopy nitrogen: a model on the implications of the use of homogeneous assimilation functions. Australian Journal of Plant Physiology 22: 425–439.
-
- BaldocchiD.1994. A comparative study of mass and energy exchange rates over a closed C3 (wheat) and an open C4 (corn) crop: II. CO2 exchange and water use efficiency. Agricultural and Forest Meteorology 67: 291–321.
