

Comparative study of brain CD8+ T cells induced by sporozoites and those induced by blood-stage Plasmodium berghei ANKA involved in the development of cerebral malaria
- PMID: 15102792
- PMCID: PMC387860
- DOI: 10.1128/IAI.72.5.2817-2826.2004
Comparative study of brain CD8+ T cells induced by sporozoites and those induced by blood-stage Plasmodium berghei ANKA involved in the development of cerebral malaria
Abstract
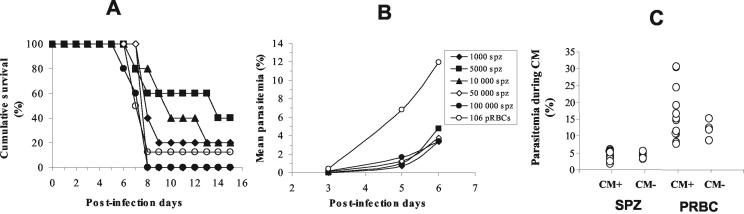
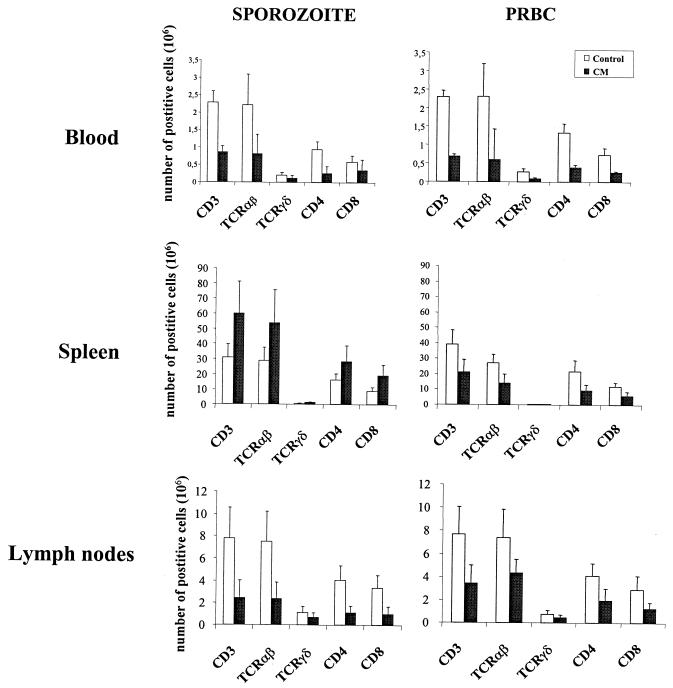
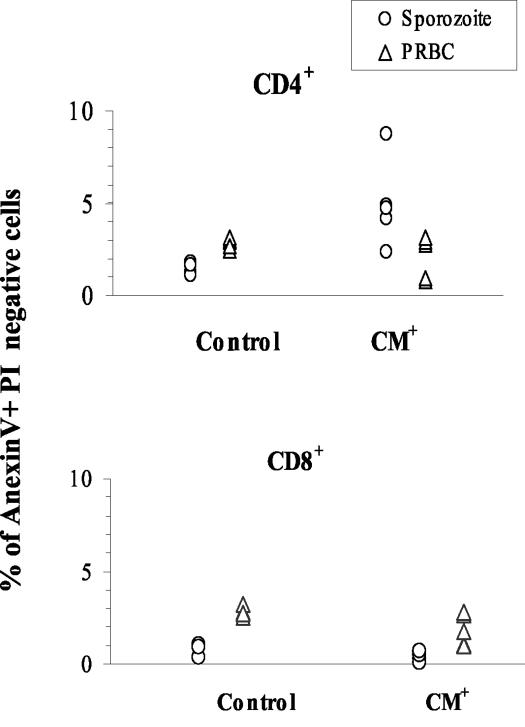
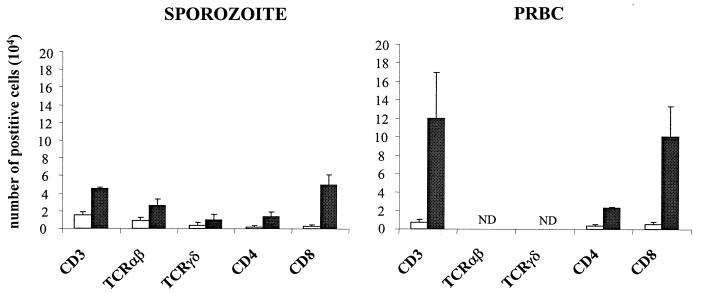
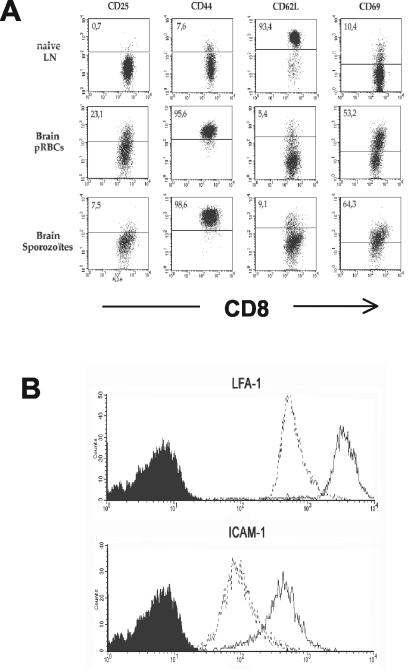
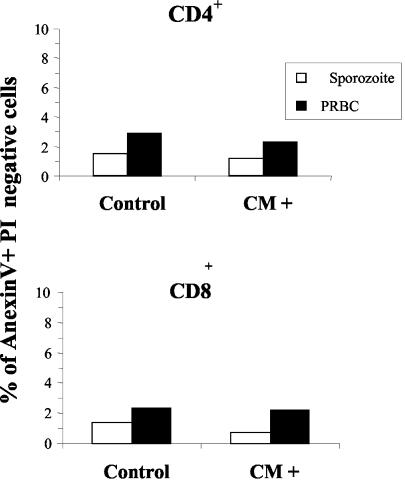
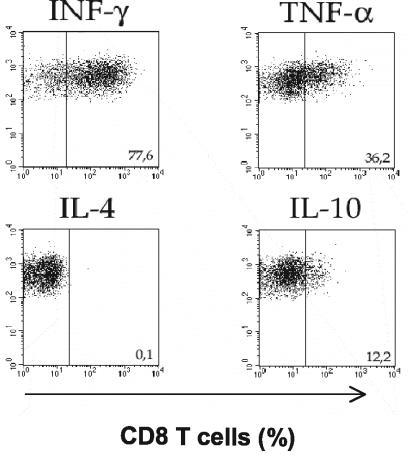
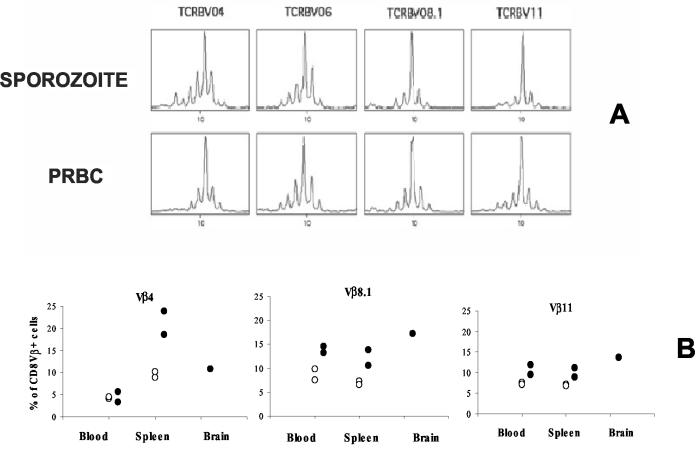
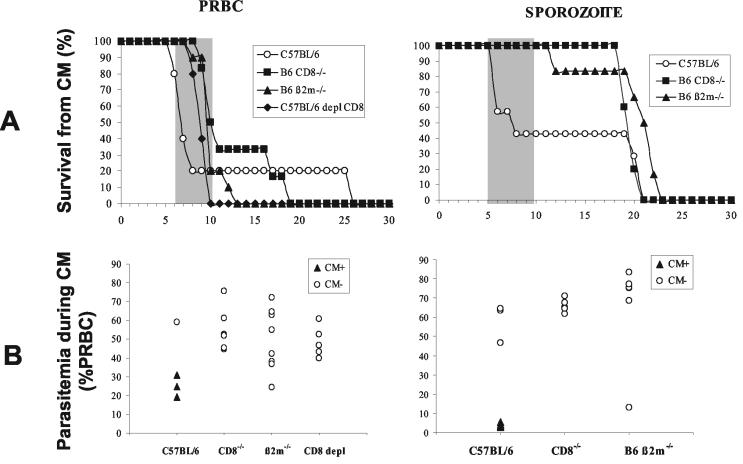
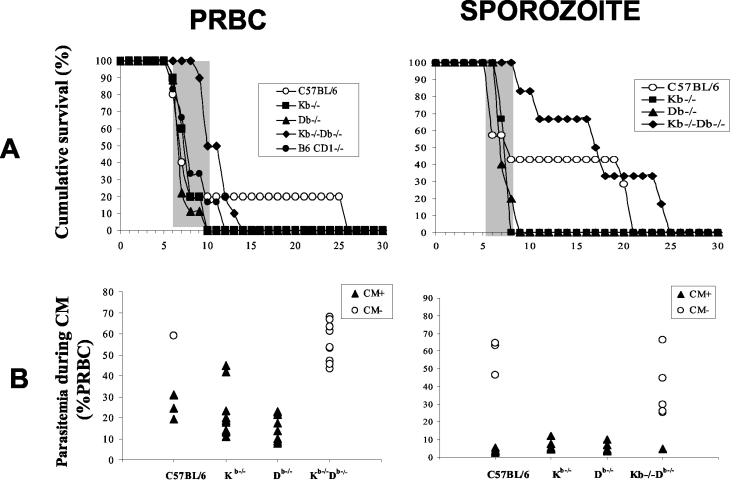
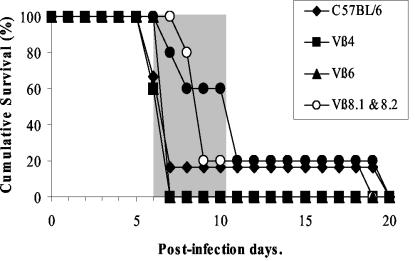
To obtain insight into the mechanisms that contribute to the pathogenesis of Plasmodium infections, we developed an improved rodent model that mimics human malaria closely by inducing cerebral malaria (CM) through sporozoite infection. We used this model to carry out a detailed study on isolated T cells recruited from the brains of mice during the development of CM. We compared several aspects of the immune response related to the experimental model of Plasmodium berghei ANKA infection induced by sporozoites in C57BL/6 mice and those related to a blood-stage infection. Our data show that in both models, oligoclonal TCRVbeta4(+), TCRVbeta6(+), TCRVbeta8.1(+), and TCRVbeta11(+) major histocompatibility complex class I-restricted CD8 T cells were present in the brains of CM(+) mice. These CD8(+) T cells display an activated phenotype, do not undergo apoptosis, secrete gamma interferon or tumor necrosis factor alpha, and are associated with the development of the neurological syndrome.
Figures
Similar articles
-
Gamma delta T-cell function in pathogenesis of cerebral malaria in mice infected with Plasmodium berghei ANKA.Infect Immun. 1999 Jan;67(1):446-8. doi: 10.1128/IAI.67.1.446-448.1999. Infect Immun. 1999. PMID: 9864254 Free PMC article.
-
Malaria-specific and nonspecific activation of CD8+ T cells during blood stage of Plasmodium berghei infection.J Immunol. 2008 Jul 15;181(2):1420-8. doi: 10.4049/jimmunol.181.2.1420. J Immunol. 2008. PMID: 18606696
-
Type I interferons contribute to experimental cerebral malaria development in response to sporozoite or blood-stage Plasmodium berghei ANKA.Eur J Immunol. 2013 Oct;43(10):2683-95. doi: 10.1002/eji.201343327. Epub 2013 Jul 19. Eur J Immunol. 2013. PMID: 23780878
-
The role of intrahepatic lymphocytes in mediating protective immunity induced by attenuated Plasmodium berghei sporozoites.Immunol Rev. 2000 Apr;174:123-34. doi: 10.1034/j.1600-0528.2002.00013h.x. Immunol Rev. 2000. PMID: 10807512 Review.
-
Pathogenic T cells in cerebral malaria.Int J Parasitol. 2006 May 1;36(5):547-54. doi: 10.1016/j.ijpara.2006.02.007. Epub 2006 Mar 10. Int J Parasitol. 2006. PMID: 16600241 Review.
Cited by
-
Genetic analysis of cerebral malaria in the mouse model infected with Plasmodium berghei.Mamm Genome. 2018 Aug;29(7-8):488-506. doi: 10.1007/s00335-018-9752-9. Epub 2018 Jun 19. Mamm Genome. 2018. PMID: 29922917 Review.
-
Autophagy Pathways in the Genesis of Plasmodium-Derived Microvesicles: A Double-Edged Sword?Life (Basel). 2022 Mar 12;12(3):415. doi: 10.3390/life12030415. Life (Basel). 2022. PMID: 35330166 Free PMC article.
-
Suppression of CD4+ Effector Responses by Naturally Occurring CD4+ CD25+ Foxp3+ Regulatory T Cells Contributes to Experimental Cerebral Malaria.Infect Immun. 2015 Nov 9;84(1):329-38. doi: 10.1128/IAI.00717-15. Print 2016 Jan. Infect Immun. 2015. PMID: 26553468 Free PMC article.
-
A TCRβ Repertoire Signature Can Predict Experimental Cerebral Malaria.PLoS One. 2016 Feb 4;11(2):e0147871. doi: 10.1371/journal.pone.0147871. eCollection 2016. PLoS One. 2016. PMID: 26844551 Free PMC article.
-
Pathogenic CD8+ T cells in experimental cerebral malaria.Semin Immunopathol. 2015 May;37(3):221-31. doi: 10.1007/s00281-015-0476-6. Epub 2015 Mar 13. Semin Immunopathol. 2015. PMID: 25772948 Review.
References
-
- Belnoue, E., M. Kayibanda, A. M. Vigario, J.C. Deschemin, N. Rooijen, M. Viguier, G. Snounou, and L. Rénia. 2003. On the pathogenic role of brain sequestered αβ CD8 T cells in experimental cerebral malaria. J. Immunol. 169:6369-6375. - PubMed
-
- Boubou, M. I., A. Collette, D. Voegtle, D. Mazier, P. A. Cazenave, and S. Pied. 1999. T cell response in malaria pathogenesis: selective increase in T cells carrying the TCR V(beta)8 during experimental cerebral malaria. Int. Immunol. 11:1553-1562. - PubMed
-
- Brown, H., T. T. Hien, N. Day, N. T. Mai, L. V. Chuong, T. T. Chau, P. P. Loc, N. H. Phu, D. Bethell, J. Farrar, K. Gatter, N. White, and G. Turner. 1999. Evidence of blood-brain barrier dysfunction in human cerebral malaria. Neuropathol. Appl. Neurobiol. 25:331-340. - PubMed
Publication types
MeSH terms
Substances
LinkOut - more resources
Full Text Sources
Other Literature Sources
Molecular Biology Databases
Research Materials
