. 2004 May;72(5):2889-98.
doi: 10.1128/IAI.72.5.2889-2898.2004.

Helicobacter pylori induces apoptosis of macrophages in association with alterations in the mitochondrial pathway

Affiliations

Helicobacter pylori induces apoptosis of macrophages in association with alterations in the mitochondrial pathway

Rena J Menaker et al. Infect Immun. 2004 May.

Abstract

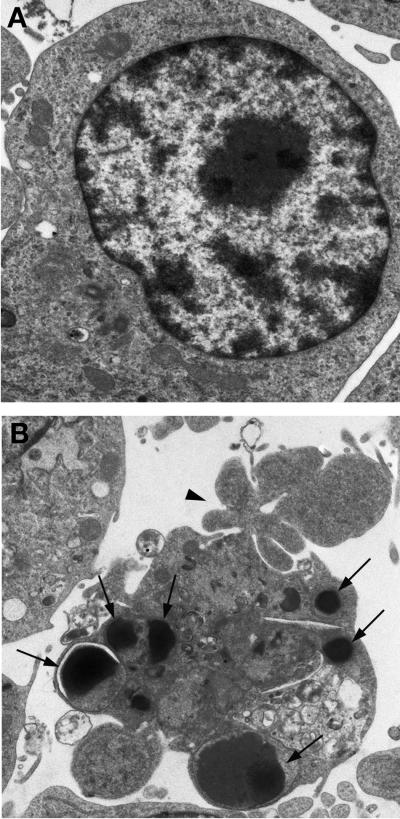
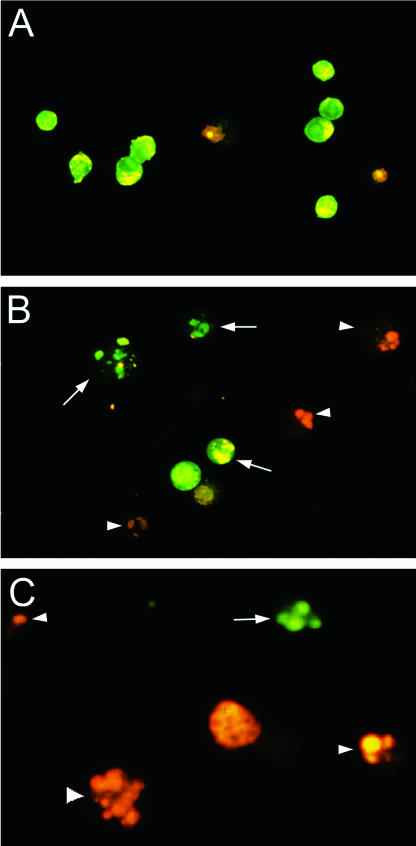
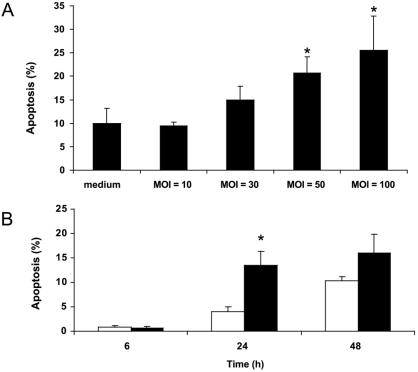
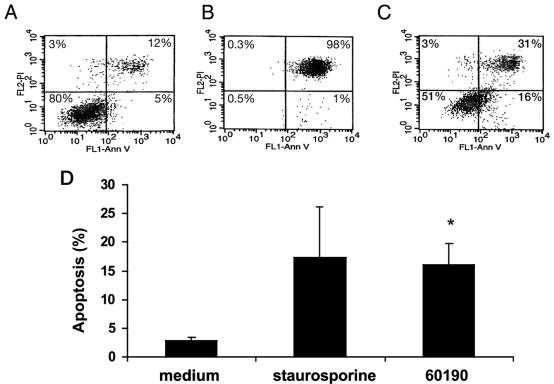
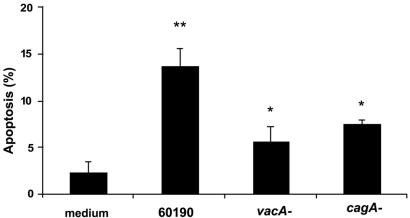
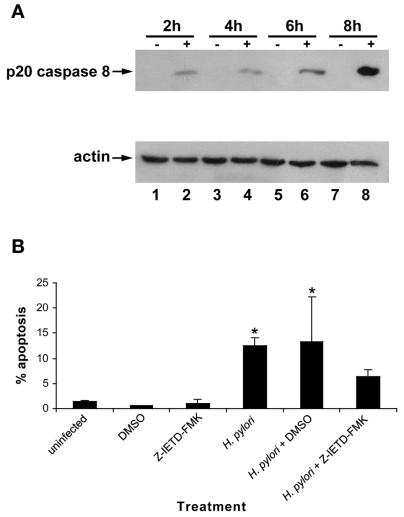
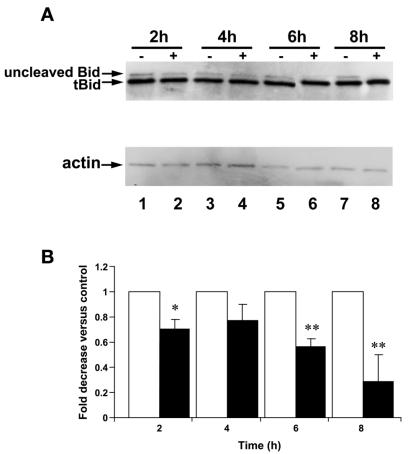
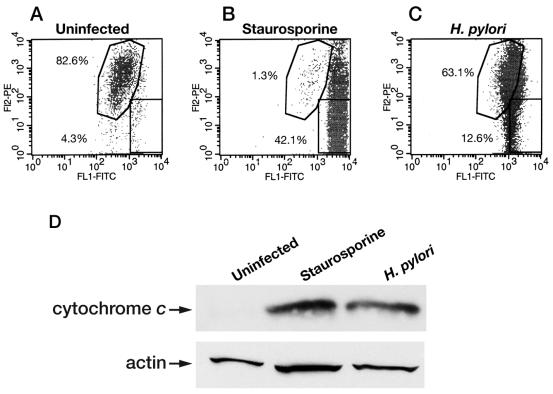
Helicobacter pylori is a gastric bacterial pathogen that evades host immune responses in vivo and is associated with the development of gastritis, peptic ulcer disease, and gastric cancers. Induction of macrophage apoptosis is a method employed by multiple pathogens to escape host immune responses. Therefore, we hypothesized that H. pylori induces apoptosis of infected macrophages. RAW 264.7 cells were infected with H. pylori strain 60190, and apoptosis was assessed. Transmission electron microscopy and fluorescence microscopy showed that infected macrophages displayed morphological features characteristic of apoptosis. Quantification by acridine orange-ethidium bromide fluorescent-dye staining showed that apoptosis was dose and time dependent, and apoptosis was further confirmed by increased binding of annexin V-fluorescein isothiocyanate (FITC) to externalized phosphatidylserine of infected but not of control macrophages. Macrophages infected with isogenic mutants of H. pylori strain 60190 deficient in either cagA or vacA induced significantly less apoptosis than the parental strain, as assessed by increased binding of annexin V-FITC. Western blot analysis of whole-cell protein lysates revealed that infection with strain 60190 induced a time-dependent increase in cleavage of procaspase 8 and disappearance of full-length Bid compared with uninfected cells. Furthermore, pharmacological inhibition of caspase 8 caused a decrease in levels of apoptosis. Finally, infection caused a time-dependent increase in mitochondrial-membrane permeability and release of cytochrome c into the cytosol. These results suggest that H. pylori induces apoptosis of macrophages in association with alterations in the mitochondrial pathway. Elimination of this key immunomodulatory cell may represent a mechanism employed by the bacterium to evade host immune responses.


Figures

FIG. 1.
FIG. 1.
Induction of apoptosis of RAW 264.7 cells by H. pylori as assessed by transmission electron microscopy. (A) Uninfected macrophages show normal cellular morphology, including intact plasma and nuclear membranes (magnification, ×20,000). (B) H. pylori-infected macrophages (24 h; MOI, 50:1) display characteristic features of apoptosis, including membrane blebbing (arrowhead), cytoplasmic vacuolation, and condensed and marginated nuclear chromatin (arrows) (magnification, approximately ×12,000).
FIG. 2.
FIG. 2.
Induction of apoptosis in RAW 264.7 cells by H. pylori as assessed by fluorescence microscopy using acridine orange and ethidium bromide staining. (A) Untreated RAW 264.7 cells show normal cellular morphology and display intact nuclear architecture, as demonstrated by the green fluorescence of their nuclei (magnification, ×250). (B) RAW 264.7 cells treated with staurosporine for 24 h (positive control for apoptosis) show morphological features characteristic of apoptosis, as demonstrated by the enhanced fluorescence of their condensed chromatin. Early apoptotic cells fluoresce green (arrows), and late apoptotic cells fluoresce orange (arrowheads) (magnification, ×250). (C) H. pylori-infected cells (MOI, 50:1; 24 h) show features of apoptosis similar to those of staurosporine-treated cells (magnification, ×400).
FIG. 3.
FIG. 3.
Quantification of fluorescence microscopy data using acridine orange and ethidium bromide staining. (A) Infection with H. pylori at MOI of 10:1, 30:1, 50:1, and 100:1 for 24 h resulted in a dose-dependent induction of apoptosis, with increased levels of apoptosis observed at MOI of 50:1 and 100:1 compared with uninfected controls (23.1% ± 8.4% and 27.9% ± 12.9%, respectively, versus 9.9% ± 5.8%; ANOVA-Bonferroni multiple-comparison test; *P < 0.004; n = 5). (B) RAW 264.7 cells infected with H. pylori (solid bars) at an MOI of 50:1 for 6, 24, or 48 h showed a time-dependent increase in apoptosis at 24 h compared with time-matched uninfected controls (open bars) (13.5% ± 2.9% versus 4.0% ± 1.0%; unpaired t test; *, P < 0.0004; n = 4). The results are expressed as mean percentages of apoptotic cells per 500 cells enumerated, and the error bars represent standard errors of the mean.
FIG. 4.
FIG. 4.
H. pylori induces apoptosis, as measured by annexin-V binding to externalized phosphatidylserine. RAW 264.7 cells were infected with H. pylori at an MOI of 50:1 for 24 h. Viable cells (annexin-V PI); nonviable, including late apoptotic or necrotic cells (annexin-V+ PI+ or annexin-V PI+); and apoptotic cells (annexin-V+ PI) were detected by the binding of Ann-V to externalized phospatidylserine in conjunction with PI, a dye excluded from viable cells. (A, B, and C) One FACS analysis representative of three individual experiments. (A) Eighty percent of uninfected RAW 264.7 cells were viable (annexin-V PI), while only 5% were apoptotic (annexin-V+ PI). (B) One percent of RAW 264.7 cells treated with 1 μM staurosporine (positive control for apoptosis) were apoptotic (annexin-V+ PI), and 98% of RAW 264.7 cells were nonviable (annexin-V+ PI+). (C) Sixteen percent of RAW 264.7 cells infected with H. pylori (60190) at an MOI of 50:1 for 24 h were apoptotic (annexin-V+ PI), and 31% of the cells were nonviable (annexin-V+ PI+). FL1, flow cytometry channel 1 to detect PI stain; FL2, flow cytometry channel 2 to detect annexin-V. (D) Combined results of three separate FACS analyses depicting the mean levels of apoptotic cells (annexin-V+ PI). Staurosporine-treated cells showed an increase in apoptosis over uninfected controls. RAW 264.7 cells infected with H. pylori (60190) at an MOI of 50:1 for 24 h showed an increase in apoptosis in comparison with uninfected controls (16.0% ± 3.7% versus 2.8% ± 0.6%; Tukey-Kramer test; *, P < 0.05).
FIG. 5.
FIG. 5.
vacA and cagA are involved in H. pylori-induced apoptosis of RAW 264.7 cells. RAW 264.7 cells infected with H. pylori strain 60190 (24 h; MOI, 100:1) showed an increase in apoptosis (annexin-V+ PI) in comparison with uninfected controls (13.8% ± 1.8% versus 2.4% ± 1.1%; ANOVA; **, P < 0.001) as assessed by Ann-V-PI binding. However, isogenic mutant strains deficient in either cagA (24 h; MOI, 100:1) or vacA (24 h; MOI, 100:1) showed a reduction in apoptosis (annexin-V+ PI) compared to RAW 264.7 cells infected with the wild-type strain (7.6% ± 0.35% and 5.7% ± 1.5%, respectively, versus 13.8% ± 1.8%; ANOVA-Tukey-Kramer test; *, P < 0.002; n = 3).
FIG. 6.
FIG. 6.
H. pylori infection of RAW 264.7 cells induces a time-dependent increase in cleavage of procaspase 8 (p20). (A) (Top) Immunoblot analysis of whole-cell protein lysates from H. pylori (60190)-infected RAW 264.7 cells probed with caspase 8 antibody. Uninfected RAW 264.7 cells (−) do not express the active caspase 8 fragment. However, H. pylori-infected RAW 264.7 cells (+) (2 to 8 h; MOI, 100:1) exhibit cleavage of procaspase 8 and appearance of caspase 8 (p20) beginning 2 h postinfection compared to time-matched uninfected controls (lanes 1 and 2). (Bottom) Actin levels were assayed to monitor protein-loading levels between samples (n = 3). (B) Preincubation with the specific caspase 8 inhibitor Z-IETD-FMK leads to a reduction in H. pylori-induced apoptosis of RAW 264.7 cells, as assessed by acridine orange-ethidium bromide fluorescent-dye staining. Similar to Fig. 2C, infection with H. pylori (24 h; MOI, 100:1) leads to an increase in levels of apoptosis compared to uninfected controls (12.5% ± 1.5% versus 1.4% ± 0.2%; ANOVA-Tukey-Kramer test; P < 0.001). However, preincubation with the caspase 8 inhibitor, but not the dimethyl sulfoxide vehicle control, caused a decrease in levels of apoptosis induced by H. pylori (6.4% ± 1.4% versus 12.5% ± 1.5%; ANOVA-Tukey-Kramer test; *, P < 0.05; n = 3). Error bars, standard errors.
FIG. 7.
FIG. 7.
Infection of RAW 264.7 cells with H. pylori leads to a time-dependent decrease in the expression of uncleaved Bid protein. (A) Whole-cell protein extracts from RAW 264.7 cells analyzed by immunoblotting. (Top) Uninfected RAW 264.7 cells (−) expressed both uncleaved (22-kDa) and cleaved (15-kDa) Bid protein. In contrast, uncleaved Bid protein expression decreased following infection with H. pylori (MOI, 100:1) (+) beginning at 6 h. (Bottom) Actin levels were assayed to monitor protein loading between samples (n = 3). (B) Densitometry corresponding to immunoblots from three separate experiments reflects decreased uncleaved Bid protein expression in H. pylori-infected samples (solid bars) when normalized to actin levels to control for protein loading (open bars) over time (*, P < 0.05; **, P < 0.001; ANOVA; n = 3). Error bars, standard errors.
FIG. 8.
FIG. 8.
H. pylori infection leads to increased mitochondrial-membrane permeability and increased cytosolic cytochrome c in RAW 264.7 cells. Macrophages were harvested after H. pylori (60190) infection (MOI, 100:1; 24 h), and mitochondrial-membrane permeability was assessed using FACS analysis. (A, B, and C) One representative FACS analysis from three separate experiments is shown, where the x axis represents fluorescence levels of monomeric dye remaining in the cytosol of cells with increased mitochondrial-membrane permeability (green emission). In contrast, the y axis represents the fluorescence levels of the aggregated dye taken up and retained in the mitochondria of cells with intact mitochondrial membranes (red emission). (A) A total of 4.3% of uninfected RAW 264.7 cells show increased mitochondrial-membrane permeability, while 82.6% show intact mitochondrial-membrane permeability. (B) A total of 42.1% of staurosporine-treated macrophages have increased mitochondrial-membrane permeability, while only 1.3% display intact mitochondrial-membrane permeability. (C) At 24 h postinfection, 12.6% of H. pylori-infected RAW 264.7 cells display increased mitochondrial-membrane permeability. FL1, flow cytometry channel 1 to detect FITC; FL2, flow cytometry channel 2 to detect PE. (D) Infection with H. pylori leads to an increase in cytosolic cytochrome c protein levels, as assessed by Western blot analysis. In comparison with cytosolic extracts from uninfected RAW 264.7 cells, H. pylori strain 60190-infected RAW 264.7 cells (H. pylori) (MOI, 100:1; 24 h) show increased protein levels of cytosolic cytochrome c, similar to staurosporine-treated cells (Staurosporine) (1 μM; 24 h; positive control; n = 3).

Similar articles

Cited by

References

    1. Allen, L. A. 1999. Intracellular niches for extracellular bacteria: lessons from Helicobacter pylori. J. Leukoc. Biol. 66:753-756. - PubMed
    1. Ashkenazi, A., and V. M. Dixit. 1998. Death receptors: signalling and modulation. Science 281:1305-1308. - PubMed
    1. Ashktorab, H., M. Neapolitano, C. Bomma, C. Allen, A. Ahmed, A. Dubois, T. Naab, and D. T. Smoot. 2002. In vivo and in vitro activation of caspase-8 and -3 associated with Helicobacter pylori infection. Microb. Infect. 4:713-722. - PubMed
    1. Atherton, J. C. 1997. The clinical relevance of strain types of Helicobacter pylori. Gut 40:701-703. - PMC - PubMed
    1. Backert, S., S. Moese, M. Selbach, V. Brinkmann, and T. F. Meyer. 2001. Phosphorylation of tyrosine 972 of the Helicobacter pylori CagA protein is essential for induction of a scattering phenotype in gastric epithelial cells. Mol. Microbiol. 42:631-644. - PubMed

Publication types

MeSH terms

LinkOut - more resources