

Maintenance of spatial and motor codes during oculomotor delayed response tasks
- PMID: 15102910
- PMCID: PMC6729424
- DOI: 10.1523/JNEUROSCI.5640-03.2004
Maintenance of spatial and motor codes during oculomotor delayed response tasks
Abstract
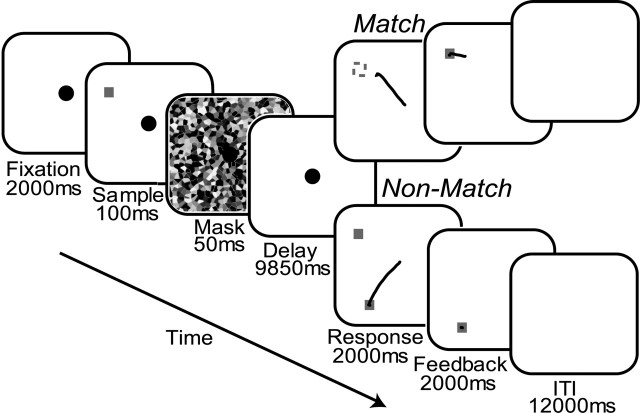
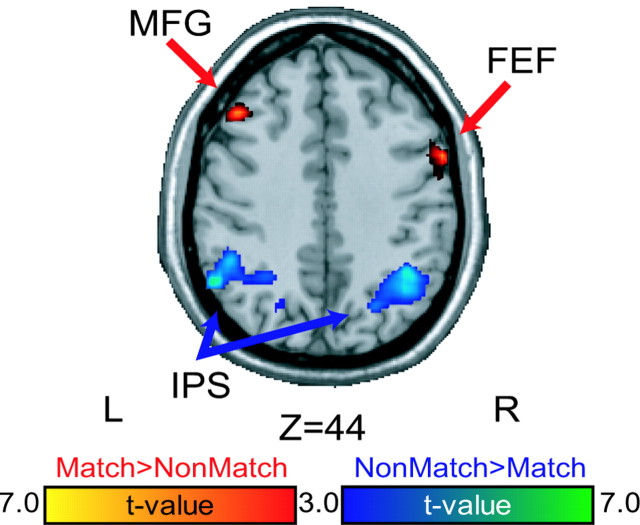
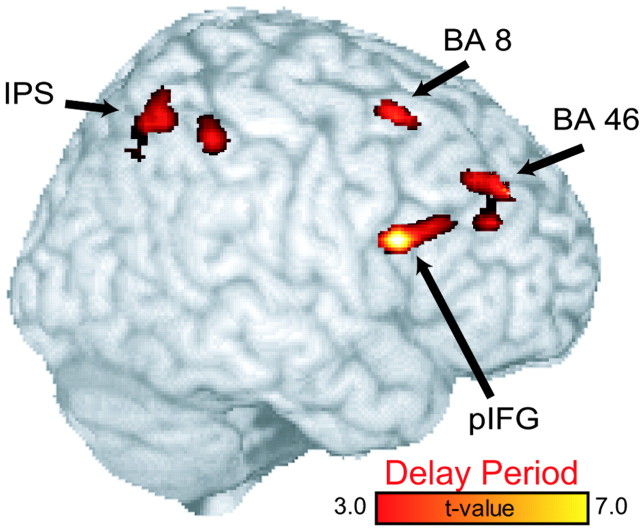
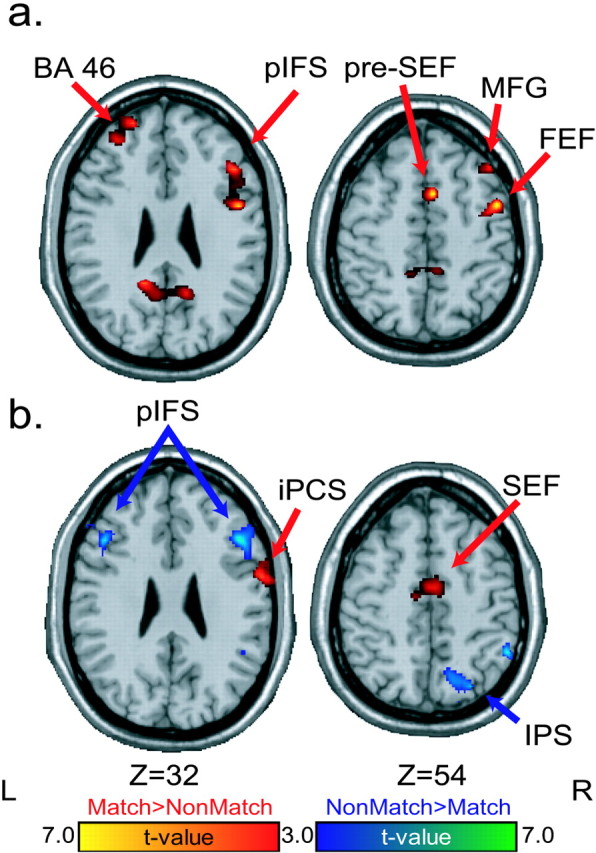
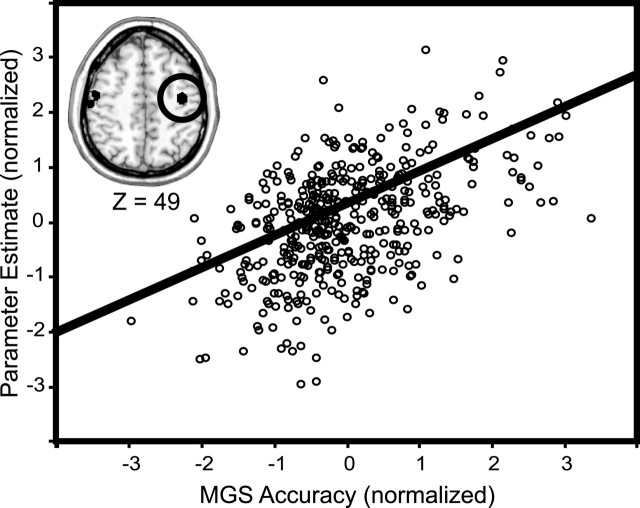
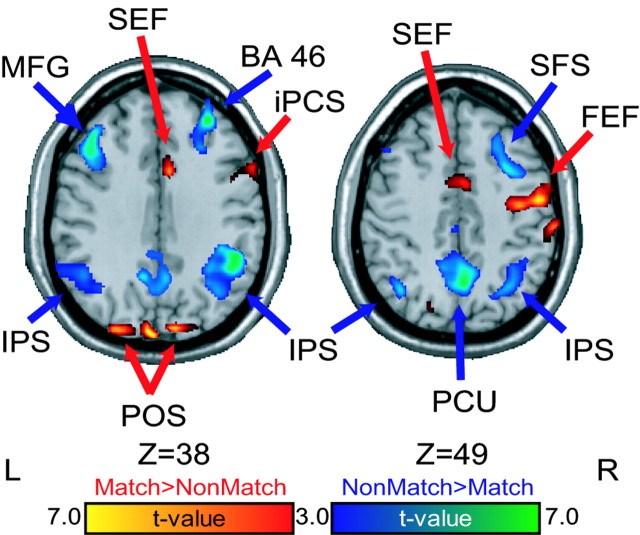
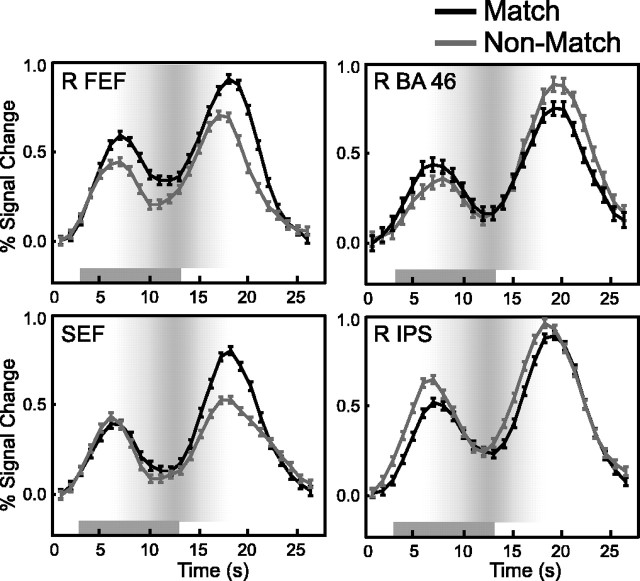
The most compelling neural evidence for working memory is persistent neuronal activity bridging past sensory cues and their contingent future motor acts. This observation, however, does not answer what is actually being remembered or coded for by this activity. To address this fundamental issue, we imaged the human brain during maintenance of spatial locations and varied whether the memory-guided saccade was selected before or after the delay. An oculomotor delayed matching-to-sample task (match) was used to measure maintained motor intention because the direction of the forthcoming saccade was known throughout the delay. We used a nonmatching-to-sample task (nonmatch) in which the saccade was unpredictable to measure maintained spatial attention. Oculomotor areas were more active during match delays, and posterior parietal cortex and inferior frontal cortex were more active during nonmatch delays. Additionally, the fidelity of the memory was predicted by the delay-period activity of the frontal eye fields; the magnitude of delay-period activity correlated with the accuracy of the memory-guided saccade. Experimentally controlling response selection allowed us to functionally separate nodes of a network of frontal and parietal areas that usually coactivate in studies of working memory. We propose that different nodes in this network maintain different representational codes, motor and spatial. Which code is being represented by sustained neural activity is biased by when in the transformation from perception to action the response can be selected.
Figures
Similar articles
-
Saccade preparation signals in the human frontal and parietal cortices.J Neurophysiol. 2008 Jan;99(1):133-45. doi: 10.1152/jn.00899.2007. Epub 2007 Nov 21. J Neurophysiol. 2008. PMID: 18032565 Free PMC article.
-
Positron emission tomography study of voluntary saccadic eye movements and spatial working memory.J Neurophysiol. 1996 Jan;75(1):454-68. doi: 10.1152/jn.1996.75.1.454. J Neurophysiol. 1996. PMID: 8822570
-
A comparison of frontoparietal fMRI activation during anti-saccades and anti-pointing.J Neurophysiol. 2000 Sep;84(3):1645-55. doi: 10.1152/jn.2000.84.3.1645. J Neurophysiol. 2000. PMID: 10980034 Clinical Trial.
-
Prefrontal and parietal contributions to spatial working memory.Neuroscience. 2006 Apr 28;139(1):173-80. doi: 10.1016/j.neuroscience.2005.04.070. Epub 2005 Dec 2. Neuroscience. 2006. PMID: 16326021 Review.
-
The role of the parietal cortex in the neural processing of saccadic eye movements.Adv Neurol. 2003;93:141-57. Adv Neurol. 2003. PMID: 12894406 Review.
Cited by
-
Functional connectivity during working memory maintenance.Cogn Affect Behav Neurosci. 2004 Dec;4(4):580-99. doi: 10.3758/cabn.4.4.580. Cogn Affect Behav Neurosci. 2004. PMID: 15849899
-
Beta Oscillatory Dynamics in the Prefrontal and Superior Temporal Cortices Predict Spatial Working Memory Performance.Sci Rep. 2018 May 31;8(1):8488. doi: 10.1038/s41598-018-26863-x. Sci Rep. 2018. PMID: 29855522 Free PMC article.
-
Disentangling working memory processes during spatial span assessment: a modeling analysis of preferred eye movement strategies.J Clin Exp Neuropsychol. 2014;36(2):186-204. doi: 10.1080/13803395.2013.877123. Epub 2014 Feb 5. J Clin Exp Neuropsychol. 2014. PMID: 24499103 Free PMC article.
-
Reduced brain activity in female patients with non-alcoholic fatty liver disease as measured by near-infrared spectroscopy.PLoS One. 2017 Apr 4;12(4):e0174169. doi: 10.1371/journal.pone.0174169. eCollection 2017. PLoS One. 2017. PMID: 28376101 Free PMC article.
-
Interference between smooth pursuit and color working memory.J Eye Mov Res. 2017 Jul 10;10(3):10.16910/jemr.10.3.6. doi: 10.16910/jemr.10.3.6. J Eye Mov Res. 2017. PMID: 33828656 Free PMC article.
References
-
- Aguirre GK, Zarahn E, D'Esposito M (1998) The variability of human, BOLD hemodynamic responses. NeuroImage 8: 360-369. - PubMed
-
- Andersen RA, Buneo CA (2002) Intentional maps in posterior parietal cortex. Annu Rev Neurosci 25: 189-220. - PubMed
-
- Awh E, Jonides J (2001) Overlapping mechanisms of attention and spatial working memory. Trends Cogn Sci 5: 119-126. - PubMed
-
- Boussaoud D, Wise SP (1993) Primate frontal cortex: neuronal activity following attentional versus intentional cues. Exp Brain Res 95: 15-27. - PubMed
-
- Brefczynski JA, DeYoe EA (1999) A physiological correlate of the “spotlight” of visual attention. Nat Neurosci 2: 370-374. - PubMed
Publication types
MeSH terms
LinkOut - more resources
Full Text Sources
Miscellaneous