. 2004 Apr 21;24(16):3999-4010.
doi: 10.1523/JNEUROSCI.0077-04.2004.

Voltage-dependent enhancement of electrical coupling by a subthreshold sodium current

Affiliations

Voltage-dependent enhancement of electrical coupling by a subthreshold sodium current

Sebastián Curti et al. J Neurosci. .

Abstract

Voltage-dependent changes in electrical coupling are often attributed to a direct effect on the properties of gap junction channels. Identifiable auditory afferents terminate as mixed (electrical and chemical) synapses on the distal portion of the lateral dendrite of the goldfish Mauthner cells, a pair of large reticulospinal neurons involved in the organization of sensory-evoked escape responses. At these afferents, the amplitude of the coupling potential produced by the retrograde spread of signals from the postsynaptic Mauthner cell is dramatically enhanced by depolarization of the presynaptic terminal. We demonstrate here that this voltage-dependent enhancement of electrical coupling does not represent a property of the junctions themselves but the activation of a subthreshold sodium current present at presynaptic terminals that acts to amplify the synaptic response. We also provide evidence that this amplification operates under physiological conditions, enhancing synaptic communication from the Mauthner cells to the auditory afferents where electrical and geometrical properties of the coupled cells are unfavorable for retrograde transmission. Retrograde electrical communication at these afferents may play an important functional role by promoting cooperativity between afferents and enhancing transmitter release. Thus, the efficacy of an electrical synapse can be dynamically modulated in a voltage-dependent manner by properties of the nonjunctional membrane. Finally, asymmetric amplification of electrical coupling by intrinsic membrane properties, as at the synapses between auditory afferents and the Mauthner cell, may ensure efficient communication between neuronal processes of dissimilar size and shape, promoting neuronal synchronization.


Figures

Figure 1.
Figure 1.
The antidromic coupling is a convenient tool to study retrograde transmission at club endings. A, Experimental arrangement. Auditory afferents (Club endings) terminate as mixed synapses (Mixed synapse) on the lateral dendrite of the Mauthner (M-) cell. The action potential produced by the antidromic stimulation of the M-cell axon in the spinal cord (M-cell AD spike) can be recorded as a coupling potential in the presynaptic afferents (AD coupling). The presynaptic recordings were either intracranial (this case) or more often in the VIIIth nerve root. B, The AD coupling is voltage dependent, increases with presynaptic membrane depolarization, and decreases with membrane hyperpolarization (current pulses of ± 0.9 nA; recording site in the VIIIth nerve root). Here and elsewhere, unless indicated, traces represent the average of at least 10 single responses. C, Quantitative analysis of the voltage dependence of AD coupling suggests the existence of two mechanisms. Relationship between the antidromic coupling potential (AD coup.; Amplitude, ordinates) and the presynaptic membrane potential (Membrane potential, abscissa) is shown. The data (open circles) were fit with a function representing the sum of an exponential and a straight line [AD coup = (A + k1*Vm) + B*ek2*Vm] and the two calculated components are also plotted alone (k1, k2). The resting potential (arrowhead) in this case was -73 mV. The horizontal dotted line represents the expected behavior if the coupling potential was not voltage dependent.
Figure 2.
Figure 2.
Kinetics of the voltage-dependent enhancement of electrical coupling. A, Depolarization not only increases the amplitude of the response but also its time-to-peak. Superimposed traces show the antidromic coupling potential recorded at resting potential (-73 mV) and at near the threshold of the cell (-66 mV). Note the increased time-to-peak of the depolarization-enhanced response. Inset, Relationship between the amplitude of the AD coupling (abscissa) and its time-to-peak (ordinate) obtained at different membrane potentials for the same fiber. Depolarization increased proportionally both the amplitude and the time-to-peak of AD coupling. B, Depolarization also slows the time course of the decay of the coupling potential. Superimposed traces represent the normalized decays of the recordings illustrated in A. There is almost a twofold increase in the estimated time constant of the decay at depolarized potentials (0.6 vs 1.1 msec). C, Depolarization-enhanced responses fluctuate in amplitude. Superimposed traces represent single consecutive responses obtained at -66 mV; note the variability in the amplitudes of the AD couplings. D, Statistical analysis of amplitude fluctuation of the AD coupling at depolarized membrane potentials. Superimposed traces illustrate the averaged (mean; calibration, 4 mV) responses with its SDs (SD; calibration, 1 mV) obtained at resting potential (top) and -66 mV (bottom) in the same experiment. Note the increase of the SD in the falling phase of the depolarization-enhanced response.
Figure 3.
Figure 3.
Time dependence of the voltage-dependent enhancement of AD coupling. A, Averaged responses, obtained at different intervals after the onset of a 50 msec depolarizing pulse, are superimposed. B, The graph summarizes the quantitative relationship between the amplitude of the antidromic coupling potential (AD Coup. Ampl., ordinate) and the interval after the onset of the pulse (Interval, abscissa) for five different experiments. The amplitude of the recorded responses decreased gradually with interval duration and reached plateau for intervals >15 msec. C, Voltage dependence of AD coupling at the end of a 50 msec depolarizing pulse (48 msec interval). AD coupling still exhibits voltage dependence (left). Quantitative relationship (right, Voltage-dep. Late; filled circles) between the amplitude of the antidromic coupling and the membrane potential of the fiber at the end of the 50 msec current pulses showed a linear relationship at both sides of the resting potential, with characteristics similar to the k1 component calculated from the voltage dependence at the onset of the pulse (k1 early). Also superimposed is the calculated k2 component (k2 early). D, The enhanced AD couplings obtained at the onset and at the end of 50 msec pulses exhibit different kinetics. The amplitudes of the antidromic coupling (ordinate) obtained at the onset (Early), at the late portion of the depolarizing pulse (Late), and at resting potential (RP) are plotted versus the time constants (abscissa) of the their respective decays (n = 5; bars represent SEM).
Figure 4.
Figure 4.
Voltage-dependent enhancement of AD coupling is blocked by both QX-314 and TTX. A, Superimposed traces obtained at resting potential (-67 mV) and -58 mV recorded 5 min (control) and 25 min (QX-314) after the penetration of the cell with an electrode containing 50 mm QX-314. Note the contrast between the marked reduction in the amplitude of the coupling recorded at the depolarized potential and the lack of change of the response obtained at resting potential. B, Quantitative relationship between the AD coupling and the membrane potential in the same fiber 5 min (control, filled circles) and 25 min after the penetration with the QX-314-containing electrode (QX-314, empty circles). The relationship observed after QX-314 is similar to the k1 component calculated early in the recording (k1 control). Inset, Suprathreshold depolarizing pulses obtained before and after intracellular injection of QX-314. Blockade of the voltage-dependent enhancement of AD coupling occurs, whereas spikes are still not significantly affected by QX-314. C, Plot of the difference between the quantitative relationships obtained at control and after the QX-314 effect in the same experiment. The component removed by QX-314 was quantitatively similar, when fitted with an exponential function, to the k2 component calculated earlier in the recording (k2 = 0.21 mV-1). D, TTX blocks the voltage-dependent enhancement of AD coupling. Superimposed traces obtained at resting potential (RP, -71 mV) and near threshold (-65) in control and after topical application of TTX (1 μm) in the VIIIth nerve. As with QX-314, note the marked reduction in the amplitude of the coupling recorded at the depolarized potential, with no significant change of the response obtained at resting potential. E, The antidromic action potential of the M-cell remained unchanged at the time that the voltage-dependent enhancement of AD coupling was already suppressed. Traces illustrate the M-cell antidromic action potential recorded simultaneously with the afferent before and 10 min after the application of TTX. F, Plot summarizes the data obtained for the QX-314 and TTX experiments. The mean amplitude of the AD coupling potential at resting potential (RP) and -60/-65 mV (Depo) are plotted before and after QX-314 (left) and TTX (right) as percentages of their amplitude at resting potential during control conditions (bars represent SEM; not visible for responses at resting potential).
Figure 5.
Figure 5.
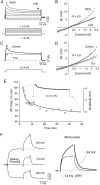
TTX-sensitive nonlinear membrane conductance contributes to the voltage dependence of AD coupling. A, Voltage responses to seven current pulses (50 msec duration, -1 to +2.4 nA; below). Note the progressively larger transient membrane response (open circle) at the pulse onset. B, Voltage (ΔV; ordinate)-current (abscissa) relation obtained in the same afferent fiber, measured at 2 (open circles) and 48 msec (filled circles). The voltage-current relation is the same at both times for hyperpolarizations, and the membrane behaves linearly in the steady state (voltage responses at ∼50 msec were fit with a straight-line function; solid line). At pulse onset, however, the V-I relationship exhibits a nonlinearity in the form of an apparent increase in membrane slope resistance with depolarization. C, Effect of 10 μm TTX on the membrane voltage responses. Superimposed traces represent the voltage responses to a pulse of +2.4 nA (below), before (Control) and 15 min after application of TTX. D, Voltage (ΔV)-current relation obtained in the same afferent fiber at the onset of the pulse before (Control, filled circles) and after (empty circles) TTX application. Voltage responses after TTX were fit with a straight-line function (solid line). Note the disappearance of the nonlinearity observed at the onset of the pulse. E, Nonlinear membrane properties match the time dependence of the voltage-dependent enhancement of AD coupling. The decay of the membrane voltage response to a +2.4 nA/50 msec pulse is illustrated superimposed to the amplitudes of the AD coupling obtained at different intervals after the onset of a 50 msec depolarizing pulse of lesser magnitude (open circles; same data shown in Fig.3B). F, Voltage-dependent changes can be replicated on a brief depolarizing current pulse injected through the presynaptic recording electrode. The depolarization produced at resting potential by a brief current pulse (1 msec duration; 0.5 nA) was dramatically enhanced by depolarization and slightly decreased by hyperpolarization (±0.9 nA). Observe the increased rise time and decay of the depolarization-enhanced response, which resembled those observed for the AD coupling (compare with Figs. 1B, 2A).
Figure 6.
Figure 6.
K+ channel blockers abolished the time dependence of voltage-dependent enhancement of AD coupling. A, Superimposed traces illustrate the antidromic coupling potential obtained at resting potential (RP, -73 mV) and at -64 mV, at the onset of a depolarizing pulse. The depolarization-enhanced AD coupling is generally followed by a small hyperpolarization (arrow), suggesting the involvement of repolarizing conductances. B, Superimposed traces illustrate the amplitude and time course of the AD coupling during a depolarization produced by current injection (0.4 nA) 1 min (Control) and 15 min after the penetration of the afferent with a recording solution containing a combination of K+ channel blockers (1.0 m TEA-Cl, 0.15 m 4-aminopyridine, 2 m CsCl). C, Voltage responses to depolarizing current steps of 0.8 nA, immediately (control) and 15 min after (K+ blockers) penetration of the fiber with an electrode containing a combination of K+ channels blockers. D, K+ channel blockers eliminate the time dependence of the voltage-dependent enhancement of AD coupling. Superimposed traces show the AD coupling at different intervals from the onset of a 0.5 nA depolarizing pulse. E, Graph summarizes the amplitude of the AD coupling (ordinate) at different intervals (abscissa) after the onset of a 50 msec depolarizing pulse for seven different fibers (open circles). The amplitudes of AD couplings obtained in the absence of K+ channel blockers in the recording solution are superimposed (filled circles; same data as illustrated in Fig. 3B). Bars represent ± SEM.
Figure 7.
Figure 7.
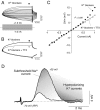
Involvement of a persistent Na+ current in the voltage-dependent enhancement of the AD coupling. A, Voltage responses to depolarizing and hyperpolarizing current pulses (50 msec duration; -1 to +1 nA) after intracellular injection of K+ channels blockers. Note the late apparent increase in the resistance of the cell (inward rectification) with progressively stronger depolarizing pulses (filled circles). B, Voltage responses to depolarizing and hyperpolarizing current pulses (±1 nA) obtained in the same afferent before and after the application of TTX (10 μm). TTX blocks the apparent increase in membrane resistance observed at the end of the depolarizing pulse induced by the injection of K+ channels blockers. C, Voltage (ΔVm, ordinate)-current (Current, abscissa) relationship obtained in the same afferent before (filled circle) and after (open circle) the application of TTX. The apparent increase in input resistance (late inward rectification) is abolished by topical application of TTX. D, Enhancement of AD coupling results from the interplay between a subthreshold Na+ current and repolarizing K+ conductances. Superimposed traces illustrate the AD coupling potential obtained at resting potential (RP; -73 mV) and at a depolarized potential (-66; same experiment illustrated in Fig. 2A). Depolarization progressively activates a subthreshold Na+ current (graded area) that is deactivated by contrasting voltage-sensitive K+ conductance(s) (darker graded area).
Figure 8.
Figure 8.
Nonlinear amplification of retrograde coupling at resting potential. A, Graph plots the amplitude of the AD coupling potentials at resting potential in control conditions (abscissa) versus their respective reduction after intracellular injection of QX-314 (ordinate) expressed as percentage of amplitude in control (n = 13). B, Simultaneous presynaptic and postsynaptic recordings between club endings and the M-cell lateral dendrite (top) allow correlation between orthodromic and antidromic coupling potentials in the same terminal. Graph (bottom) illustrates the relationship between the amplitude of orthodromic (abscissa) and antidromic (ordinates) coupling potentials in six terminals, obtained while recording from the same dendrite. The dotted line represents the linear relationship between orthodromic and antidromic couplings estimated using the three terminals that exhibit small orthodromic coupling potentials with, presumably, lower conducting junctions. Club endings that exhibit larger orthodromic potentials (presumably higher conducting junctions) showed AD couplings that were bigger than those expected from the relationship obtained in low-conducting terminals.
Figure 9.
Figure 9.
Voltage-dependent enhancement of retrograde electrical coupling operates under physiological conditions. A, Dendritic synaptic potentials (Mauthner cell) evoked by suprathreshold electrical or natural stimulation of VIIIth nerve afferents (B, C, top traces; dark orange afferents; VIIIth Nerve stim. and Sound click) can be recorded as coupling potential, in neighboring, subthreshold terminals (yellow terminals, club ending; bottom traces in B and C, respectively). INa+P = persistent (subthreshold) Na+ current in the club endings. B, Mixed synaptic response (electrical and chemical) produced by extracellular electrical stimulation of the posterior branch of the VIIIth nerve (VIIIth Nerve stim.) evokes a retrograde coupling potential in a subthreshold terminal (bottom; VIIIth Nerve coup.). Inset, Amplitude of the VIIIth nerve coupling (asterisk) was adjusted to be at the threshold of the presynaptic afferent (truncated spike, 100 mV). Superimposed traces in the bottom panel represent the amplitude of this retrograde response obtained right after (control) and 15 min after the penetration of the terminal with an electrode containing a 50 mm solution of QX-314 (A, QX-314). C, Intradendritically recorded sound-evoked synaptic potential (Sound click; 500 μsec pulse) can also be recorded, intracranially, as a coupling potential in neighboring inactive terminals (bottom; Sound coup.). Superimposed traces represent the retrograde responses obtained right after (Control) and 5 min after the penetration of the synaptic terminal with an electrode containing QX-314. Note the reduction in amplitude of both retrograde coupling potentials observed after injection of QX-314 (red traces). D, Depolarization-enhanced retrograde coupling can recruit subthreshold afferents. The AD coupling was paired with a presynaptic depolarization (blue trace; compare the enhanced response with that obtained at resting potential; black trace; RP) at a membrane potential in which it was able to occasionally elicit action potentials in the presynaptic afferent (black trace; truncated spike, 100 mV). Intracellular injection of QX-314 (red trace) removes the amplification of AD coupling (along with a small reduction in the depolarization produced in the current pulse), which is not longer capable of eliciting action potentials in the afferent. Inset, Effects of QX-314 occurred within a time window in which the fast action potentials of the afferents remained largely unaffected. Superimposed recordings show the amplitude of the action potential of the recorded afferent in control (black trace) and after QX-314 (red trace) at the time in which the changes in the AD coupling amplitude were observed.

Similar articles

Cited by

References

    1. Auerbach AA, Bennett MVL (1969) A rectifying synapse in the central nervous system of a vertebrate. J Gen Physiol 53: 183-210. - PMC - PubMed
    1. Barrio L, Schuyna T, Bargiello TA, Xian Hu L, Roginski R, Bennett MVL, Nicholson B (1991) Gap junctions formed by connexin 26 and 32 alone and in combination are differently affected by applied voltage. Proc Natl Acad Sci USA 88: 8410-8414. - PMC - PubMed
    1. Bartelmez GW (1915) Mauthner's cell and the nucleus motorius tegmenti. J Comp Neurol 25: 87-128.
    1. Bennett MVL (1966) Physiology of electrotonic junctions. Ann NY Acad Sci 137: 509-539. - PubMed
    1. Bennett MVL (1977) Electrical transmission: a functional analysis and comparison with chemical transmission. In: Cellular biology of neurons, Vol I, Handbook of physiology. The nervous system (Kandel ER, ed) pp 357-416. Baltimore: Williams & Wilkins.

Publication types

MeSH terms

LinkOut - more resources