

An orderly retreat: Dedifferentiation is a regulated process
- PMID: 15103019
- PMCID: PMC406456
- DOI: 10.1073/pnas.0306983101
An orderly retreat: Dedifferentiation is a regulated process
Abstract
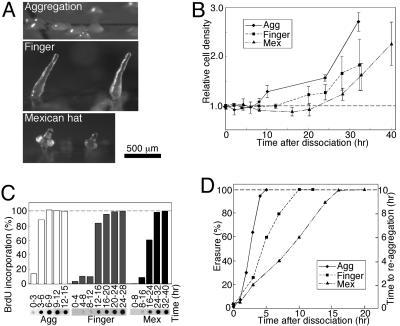
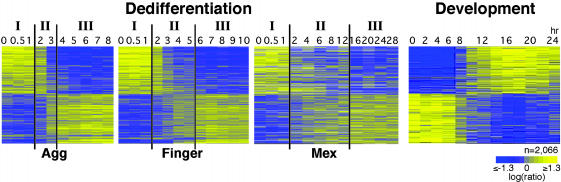
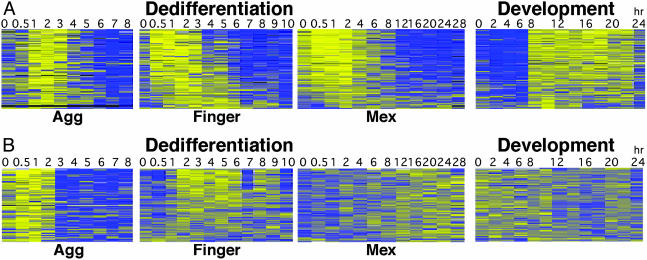
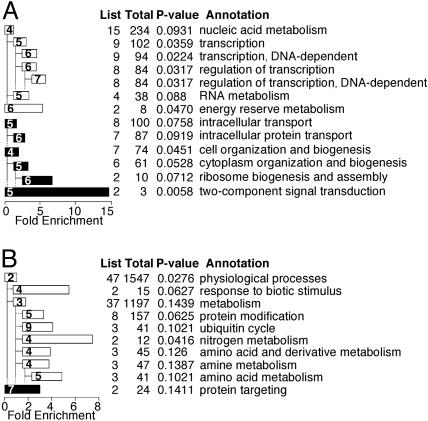
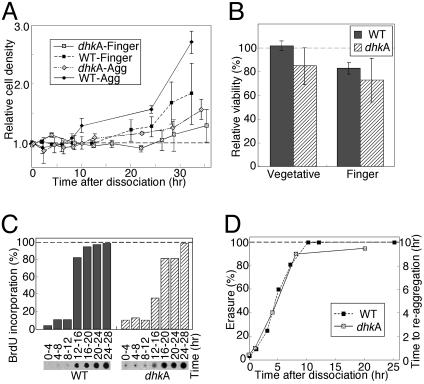
Differentiation is a highly regulated process whereby cells become specialized to perform specific functions and lose the ability to perform others. In contrast, the question of whether dedifferentiation is a genetically determined process, or merely an unregulated loss of the differentiated state, has not been resolved. We show here that dedifferentiation in the social amoeba Dictyostelium discoideum relies on a sequence of events that is independent of the original developmental state and involves the coordinated expression of a specific set of genes. A defect in one of these genes, the histidine kinase dhkA, alters the kinetics of dedifferentiation and uncouples the progression of dedifferentiation events. These observations establish dedifferentiation as a genetically determined process and suggest the existence of a developmental checkpoint that ensures a return path to the undifferentiated state.
Figures
Similar articles
-
Plasticity in the development and dedifferentiation of Dictyostelium discoideum.Dev Growth Differ. 2011 May;53(4):587-96. doi: 10.1111/j.1440-169X.2011.01256.x. Dev Growth Differ. 2011. PMID: 21585361
-
Biological and molecular correlates between induced dedifferentiation and spore germination in Dictyostelium.Development. 1992 Oct;116(2):417-25. doi: 10.1242/dev.116.2.417. Development. 1992. PMID: 1286616
-
Loss and resynthesis of a developmentally regulated membrane protein (gp80) during dedifferentiation and redifferentiation in Dictyostelium.Dev Biol. 1983 Aug;98(2):502-9. doi: 10.1016/0012-1606(83)90379-2. Dev Biol. 1983. PMID: 6409694
-
Control of spatial patterning and cell-type proportioning in Dictyostelium.Semin Cell Dev Biol. 1999 Dec;10(6):597-607. doi: 10.1006/scdb.1999.0343. Semin Cell Dev Biol. 1999. PMID: 10706824 Review.
-
Dictyostelium discoideum: a model system for differentiation and patterning.Int J Dev Biol. 2000 Dec;44(8):819-35. Int J Dev Biol. 2000. PMID: 11206323 Review.
Cited by
-
Transcriptional transitions during Dictyostelium spore germination.Eukaryot Cell. 2004 Oct;3(5):1101-10. doi: 10.1128/EC.3.5.1101-1110.2004. Eukaryot Cell. 2004. PMID: 15470238 Free PMC article.
-
Cell type-specific filamin complex regulation by a novel class of HECT ubiquitin ligase is required for normal cell motility and patterning.Development. 2011 Apr;138(8):1583-93. doi: 10.1242/dev.063800. Epub 2011 Mar 9. Development. 2011. PMID: 21389049 Free PMC article.
-
Developmental commitment in Dictyostelium discoideum.Eukaryot Cell. 2007 Nov;6(11):2038-45. doi: 10.1128/EC.00223-07. Epub 2007 Sep 28. Eukaryot Cell. 2007. PMID: 17905919 Free PMC article.
-
dictyExpress: a Dictyostelium discoideum gene expression database with an explorative data analysis web-based interface.BMC Bioinformatics. 2009 Aug 25;10:265. doi: 10.1186/1471-2105-10-265. BMC Bioinformatics. 2009. PMID: 19706156 Free PMC article.
-
Palatal Polymorphous Adenocarcinoma with High-Grade Transformation: A Case Report and Literature Review.Head Neck Pathol. 2019 Jun;13(2):131-139. doi: 10.1007/s12105-018-0916-4. Epub 2018 Mar 29. Head Neck Pathol. 2019. PMID: 29594833 Free PMC article.
References
-
- Gimm, O. (2001) Cancer Lett. 163, 143-156. - PubMed
-
- Dominguez-Malagon, H. & Gaytan-Graham, S. (2001) Ultrastruct. Pathol. 25, 497-516. - PubMed
-
- Matias-Guiu, X., Catasus, L., Bussaglia, E., Lagarda, H., Garcia, A., Pons, C., Munoz, J., Arguelles, R., Machin, P. & Prat, J. (2001) Hum. Pathol. 32, 569-577. - PubMed
-
- Tsonis, P. A. (2000) Dev. Biol. 221, 273-284. - PubMed
-
- Loomis, W. F. (1975) Dictyostelium discoideum: A Developmental System (Academic, New York).
Publication types
MeSH terms
Grants and funding
LinkOut - more resources
Full Text Sources
