. 2004:6:23-34.
doi: 10.1251/bpo70. Epub 2004 Mar 19.

Negative Staining and Image Classification - Powerful Tools in Modern Electron Microscopy

Affiliations

Negative Staining and Image Classification - Powerful Tools in Modern Electron Microscopy

Melanie Ohi et al. Biol Proced Online. 2004.

Abstract

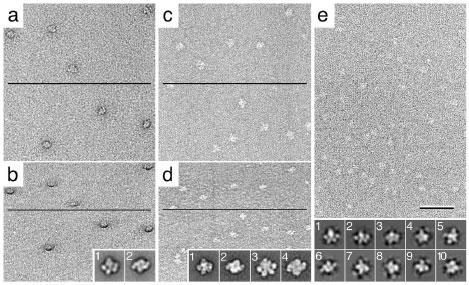
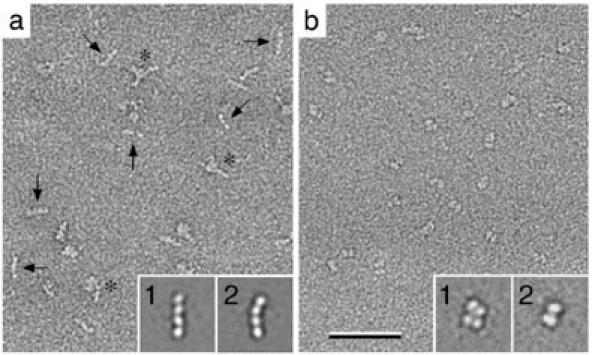
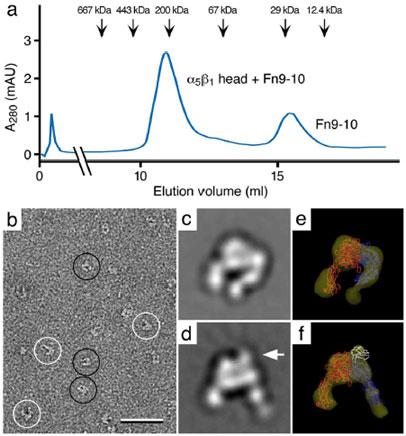
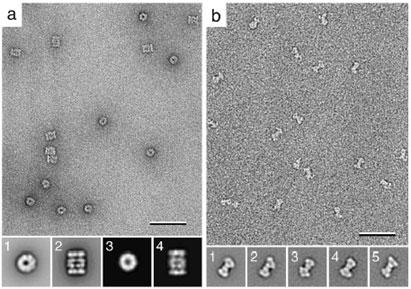
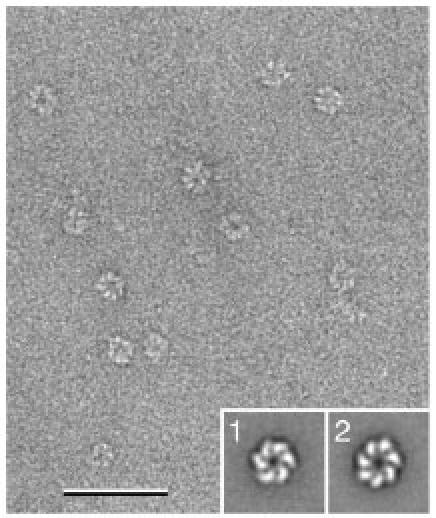
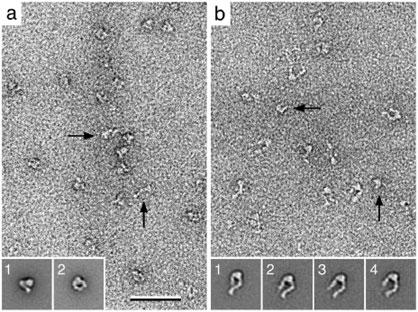
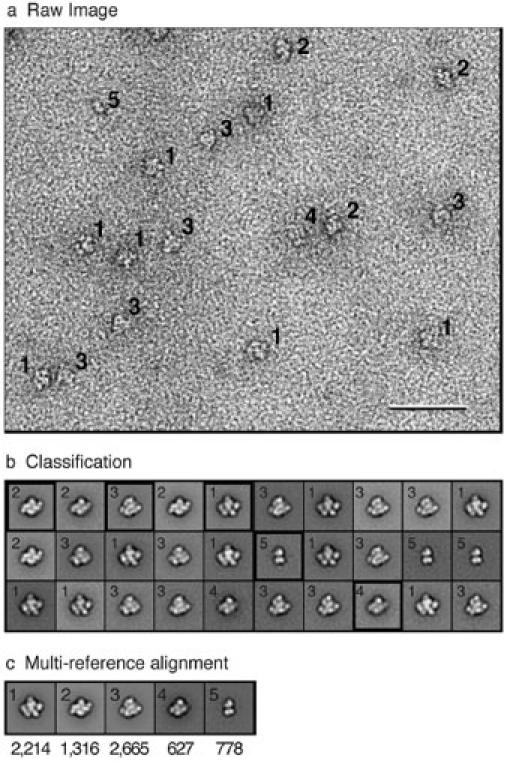
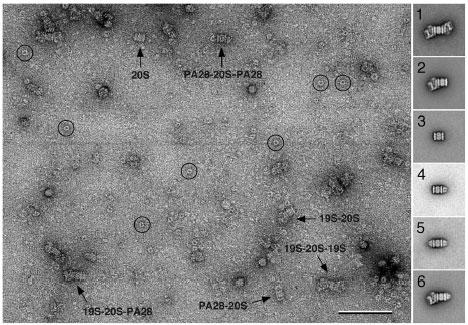
Vitrification is the state-of-the-art specimen preparation technique for molecular electron microscopy (EM) and therefore negative staining may appear to be an outdated approach. In this paper we illustrate the specific advantages of negative staining, ensuring that this technique will remain an important tool for the study of biological macromolecules. Due to the higher image contrast, much smaller molecules can be visualized by negative staining. Also, while molecules prepared by vitrification usually adopt random orientations in the amorphous ice layer, negative staining tends to induce preferred orientations of the molecules on the carbon support film. Combining negative staining with image classification techniques makes it possible to work with very heterogeneous molecule populations, which are difficult or even impossible to analyze using vitrified specimens.


Figures

Fig. 1
Fig. 1. Images of the TfR-Tf complex obtained with different negative staining protocols.
a and b: Images of an untilted (a) and a 60° tilted sample (b) prepared by the conventional negative staining protocol using uranyl formate. The particles are surrounded by a dark stain cloud, which is particularly evident in the image of the tilted specimen. Class averages (insets) show the two predominant orientations, in which the complex adsorbs to the carbon film, revealing a side view (inset 1) and a top view (inset 2) of the complex. c and d: Images of an untilted (c) and a 60° tilted sample (d) prepared by the carbon sandwich technique using uranyl formate. The negative stain forms a continuous layer and no stain cloud is apparent in images of untilted or tilted specimens. Class averages show that the complexes are seen in the same orientations as in the conventional negative staining protocol (insets 1 and 2). Due to the additional carbon layer, a significant number of complexes are being squashed upon drying and therefore can not be used for structure determination (insets 3 and 4). e: Image obtained with an untilted sample embedded in a mixture of glucose and ammonium molybdate, showing the image contrast to be much weaker than in the case of uranyl formate staining. Classification of particles selected from such images reveals that the molecules adsorb to the grid in random orientations. Some of the resulting class averages are shown in insets 1 to 10. The lines in panels a to d indicate the tilt axis. The scale bar corresponds to 50 nm and the inset panels have a side length of 26 nm.
Fig. 2
Fig. 2. Visualizing small molecules (< 100 kDa) prepared by the conventional negative staining protocol using uranyl formate.
a: Image of a mixture of integrin α5β1 headpieces and a fibronectin (Fn) fragment containing Fn domains 7 to 10 (Fn7-10, MW ~40 kDa). The image not only visualizes the Fn7-10 fragment bound to the α5β1 headpiece (asterisks), but also unbound Fn7-10 fragment (arrows). Class averages of the unbound Fn7-10 fragment obtained from such images resolve the four individual 10-kDa domains in the flexible Fn7-10 fragment (insets 1 and 2). b: Individual molecules can clearly be seen in images of negatively stained Tf molecules (MW~ 70 kDa). Class averages show a top view (inset 1) and a side view of the molecule (inset 2). The top view resolves the two lobes of Tf (MW ~35 kDa) as well as the two domains of each lobe (MW ~17 kDa). The scale bar corresponds to 50 nm and the inset panels have a side length of 26 nm. Insets in Figure 4a modified and reprinted from (10). Copyright 2003 with permission from EMBO Journal.
Fig. 3
Fig. 3. Negative stain electron microscopy of the integrin α5β1 headpiece with and without a bound fibronectin (Fn) fragment containing Fn domains 7 to 10 (Fn9-10).
a: Elution profile from a gel filtration column used to purify the complex of α5β1 headpiece with an Fn9-10 fragment. The elution profile shows two peaks that correspond to the α5β1-Fn9-10 complex (~200 kDa) and unbound Fn9-10 fragment (~30 kDa). b: Negative stain electron microscopy reveals that the α5β1 headpiece adopts two conformations, namely a closed (black circles) and an open conformation (white circles). c and d: Class averages representing the closed (c) and the open conformation (d). Binding of Fn9-10 fragment (arrow in d) induces the open conformation of the headpiece, while the unliganded is in the closed conformation (c). e and f: 3D reconstructions of an unliganded (e) and an Fn9-10-liganded α5β1 headpiece (f) with the fit atomic structures of the αV and β3 subunit (33) in red and blue, respectively, and of the Fn9-10 fragment (34) in white. The scale bar corresponds to 50 nm and panels c to f have a side length of 22 nm. Figure panels modified and reprinted from (10). Copyright 2003 with permission from EMBO Journal.
Fig. 4
Fig. 4. Apparent sample heterogeneity due to different particle orientations.
a: Image of a negatively stained yeast proteasomes. Classification of the particle images yielded two class averages (insets 1 and 2). Comparison of the two class averages with projections from a resolution-limited model generated from the crystal structure (26) identified the two averages to correspond to a top (inset 3) and a side view (inset 4) of the proteasome. b: Image of negatively stained yeast Sec23p/Sec24p complexes. Classification of the particle images yielded a variety of slightly different class averages. 3D reconstructions of the classes shown in insets 1 to 5, calculated using images of tilted specimens, looked identical, demonstrating that the variations in the class averages are due to slightly different orientations, in which the complexes adsorbed to the carbon film. The scale bars correspond to 50 nm and the inset panels have a side length of 34 nm in a and 32 nm in b. Figure 4b modified and reprinted from (7). Copyright 2001 with permission from the National Academy of Sciences, USA.
Fig. 5
Fig. 5. Sample heterogeneity due to different oligomeric states.
Image of negatively stained T7 helicase/primase in the presence of dTDP. While the particles appear rather homogeneous in the micrograph, image classification revealed the protein formed six- (inset 1) as well as seven-membered rings. The scale bar corresponds to 50 nm and the inset panels have a side length of 30 nm.
Fig. 6
Fig. 6. Conformational equilibrium of integrin αVβ3.
a: Image of αVβ3 in the presence of inhibiting Ca2+ ions, where most of the molecules adopt a compact, closed conformation (insets 1 and 2 show representative class averages). Some of the molecules however can be seen in an extended, open conformation (arrows). b: In the presence of activating Mn2+ ions, the situation is reversed and most molecules are in the extended conformation (insets 1 to 4 show representative class averages), while only few molecules adopt the compact conformation (arrows). The scale bar corresponds to 50 nm and the inset panels have a side length of 40 nm. Figure 4 modified and reprinted from (9). Copyright 2002 with permission from Elsevier.
Fig. 7
Fig. 7. Quantitative classification of TfR-Tf complexes.
a: Image of a 1:1 mixture of Tf and TfR, revealing five different particle types. b: Classification of the particle images into 30 classes yielded five unique projection averages corresponding to TfR with two Tf molecules bound (label 1: side view; label 2: top view), TfR with one Tf molecule bound (label 3), TfR by itself (label 4), and Tf by itself (label 5). One projection average for each unique class was selected for multi-reference alignment (black frames). c: Final projection averages of the five classes with the number of particle images in each class noted below. The scale bar corresponds to 50 nm and the panels in b and c have a side length of 30 nm.
Fig. 8
Fig. 8. Complexes formed in a mixture of 20S proteasome, 19S regulatory particle and the α subunit of proteasome activator PA26.
Image of a mixture of 26S proteasome with an excess of PA26α. Due to its low binding affinity for the proteasome, many unbound PA26α rings are present in this preparation (circles). Classification of images of proteasome-containing particles yielded projection averages of all the expected complexes, namely 20S proteasome with two (inset 1) or one 19S regulatory particles bound (inset 2), unliganded 20S proteasome (inset 3), 20S proteasome with one (inset 4) or two PA26α rings bound (inset 5) as well as the ternary complex of a 20S proteasome with a 19S regulatory particle and a PA26α ring (inset 6). The scale bar corresponds to 50 nm and the inset panels have a side length of 48 nm. Figure modified and reprinted from (10). Copyright 2003 with permission from EMBO Journal.
Fig. 9
Fig. 9. Single-particle processing of 2D crystals formed by RC-LH1 photounits from Rhodobacter sphaeroides.
a and b: Image of a negatively stained RC-LH1 2D crystal (a) and the corresponding calculated power spectrum (b). c: The same crystal area as in panel a after Fourier-peak filtration, revealing the individual RC-LH1 complexes. d: Projection structure of the RC-LH1 complex obtained by crystallographic averaging of the image shown in a. e: Single particle average of the unit cells marked in panel c without rotational alignment. f: Single particle average of the same unit cells used to generate the average in panel e after rotational alignment. While the RC in the center of the LH1 ring has no features in averages d and e, it has a distinct shape in average f. The scale bars in a and c correspond to 100 nm, the scale bar in b to (6 nm)-1, and panels d to f have a side length of 18 nm. Figure modified and reprinted from (13). Copyright 1998 with permission from Elsevier.

Similar articles

Cited by

References

    1. Radermacher M, Wagenknecht T, Verschoor A, Frank J. Three-dimensional reconstruction from a single-exposure, random conical tilt series applied to the 50S ribosomal subunit of Escherichia coli. J Microsc. 1987;146:113–136. - PubMed
    1. Adrian M, Dubochet J, Lepault J, McDowall AW. Cryo-electron microscopy of viruses. Nature. 1984;308:32–36. - PubMed
    1. Orlova EV, Rahman MA, Gowen B, Volynski KE, Ashton AC, Manser C, van Heel M, Ushkaryov YA. Structure of alpha-latrotoxin oligomers reveals that divalent cation-dependent tetramers form membrane pores. Nat Struct Biol. 2000;7:48–53. doi: 10.1038/71247. - DOI - PubMed
    1. Stark H, Dube P, Luhrmann R, Kastner B. Arrangement of RNA and proteins in the spliceosomal U1 small nuclear ribonucleoprotein particle. Nature. 2001;409:539–542. doi: 10.1038/35054102. - DOI - PubMed
    1. Cheng Y, Zak O, Aisen P, Harrison SC, Walz T. Structure of the human transferrin receptor-transferrin complex. Cell. 2004;116:565–576. - PubMed