

Analysis of the effects of chlorhexidine on oral biofilm vitality and structure based on viability profiling and an indicator of membrane integrity
- PMID: 15105093
- PMCID: PMC400577
- DOI: 10.1128/AAC.48.5.1461-1468.2004
Analysis of the effects of chlorhexidine on oral biofilm vitality and structure based on viability profiling and an indicator of membrane integrity
Abstract
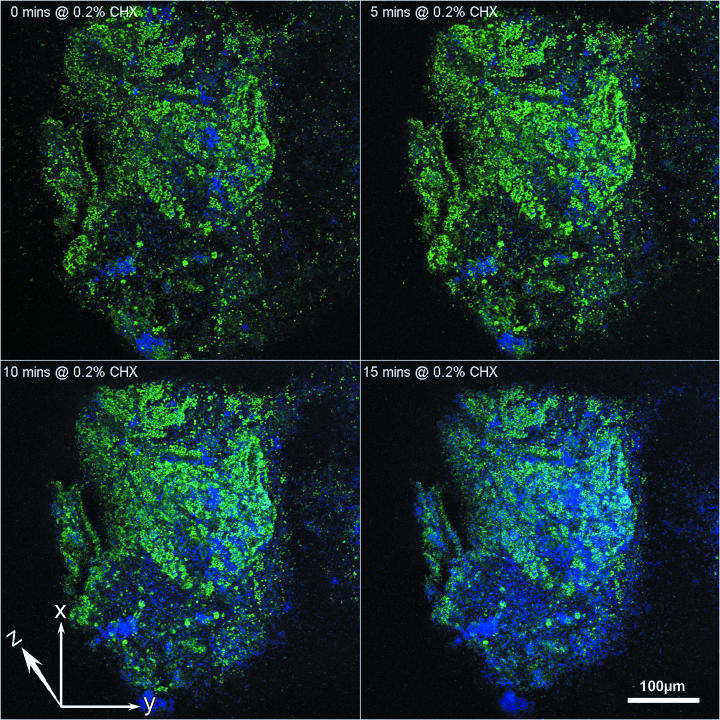
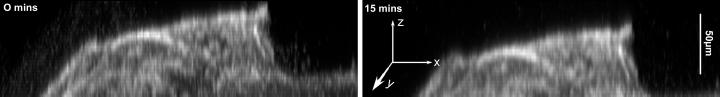
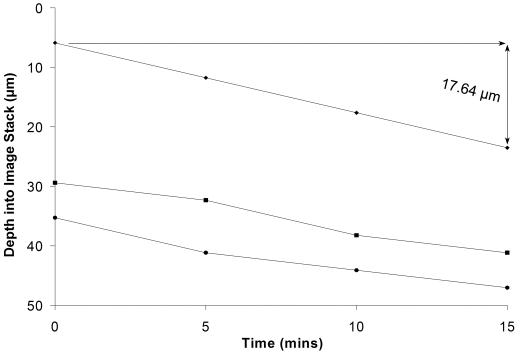
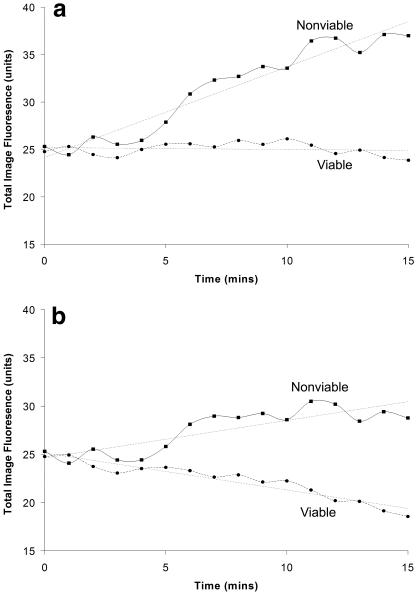
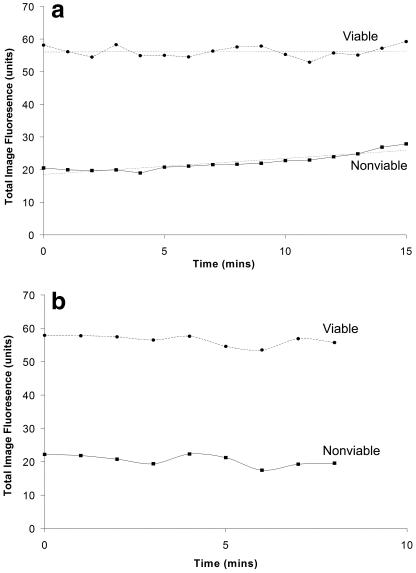
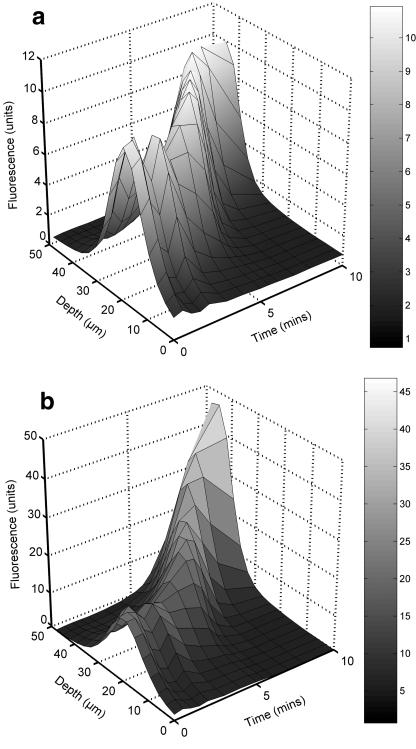
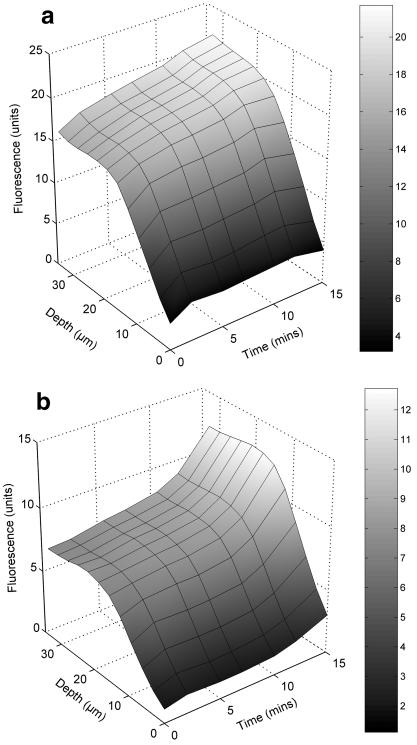
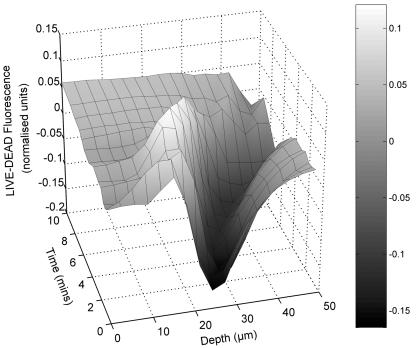
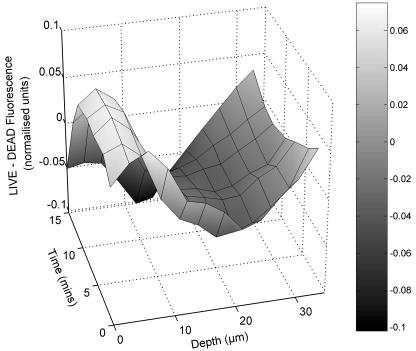
Multispecies biofilms modeling interproximal plaque were grown on a hydroxyapatite substratum in a constant-depth film fermentor and then immersed in a viewing solution containing fluorescent indicators of membrane integrity. Confocal laser scanning microscopy (CLSM) revealed the structure and spatial distribution of cell vitality within the biofilms. Chlorhexidine gluconate (CHX) was added to the viewing solution to achieve concentrations of 0.05 and 0.2% (wt/vol) before further CLSM time-lapse series were captured. Image analysis showed that exposure to 0.2% CHX caused the biofilm to contract at a rate of 1.176 micro m min(-1) along the z axis and also effected changes in total fluorescence measurements and viability profiles through the biofilms after a delay of 3 to 5 min. At a concentration of 0.05% CHX, total fluorescence measurements for the biofilm exhibited barely detectable changes after 5 min. Fluorescence profiles (fluorescence versus time versus depth), however, clearly showed that a time-dependent effect was present, but the clearest indicator of the effect of dilute CHX over time was viability profiling. These findings suggest the possibility of using fluorescent indicators of membrane integrity in conjunction with viability profiling to evaluate the penetration of the bactericidal effects of membrane-active antimicrobial compounds into biofilm.
Figures
Similar articles
-
Characterization and application of a flow system for in vitro multispecies oral biofilm formation.J Periodontal Res. 2014 Jun;49(3):323-32. doi: 10.1111/jre.12110. Epub 2013 Jul 1. J Periodontal Res. 2014. PMID: 23815431
-
Conofocal microscopy study of undisturbed and chlorhexidine-treated dental biofilm.J Dent Res. 2001 May;80(5):1436-40. doi: 10.1177/00220345010800051001. J Dent Res. 2001. PMID: 11437215
-
Evaluation of the effect of two chlorhexidine preparations on biofilm bacteria in vitro: a three-dimensional quantitative analysis.J Endod. 2009 Jul;35(7):981-5. doi: 10.1016/j.joen.2009.04.030. J Endod. 2009. PMID: 19567319
-
High-Velocity Microsprays Enhance Antimicrobial Activity in Streptococcus mutans Biofilms.J Dent Res. 2016 Dec;95(13):1494-1500. doi: 10.1177/0022034516662813. Epub 2016 Aug 23. J Dent Res. 2016. PMID: 27554642
-
Confusion over live/dead stainings for the detection of vital microorganisms in oral biofilms--which stain is suitable?BMC Oral Health. 2014 Jan 11;14:2. doi: 10.1186/1472-6831-14-2. BMC Oral Health. 2014. PMID: 24410850 Free PMC article. Review.
Cited by
-
Antibiofilm Activities of a Novel Chimeolysin against Streptococcus mutans under Physiological and Cariogenic Conditions.Antimicrob Agents Chemother. 2016 Nov 21;60(12):7436-7443. doi: 10.1128/AAC.01872-16. Print 2016 Dec. Antimicrob Agents Chemother. 2016. PMID: 27736755 Free PMC article.
-
Evaluating the Effects of Disinfectants on Bacterial Biofilms Using a Microfluidics Flow Cell and Time-Lapse Fluorescence Microscopy.Microorganisms. 2020 Nov 22;8(11):1837. doi: 10.3390/microorganisms8111837. Microorganisms. 2020. PMID: 33266442 Free PMC article.
-
Effect of flavonoids from grape seed and cranberry extracts on the microbiological activity of Streptococcus mutans: a systematic review of in vitro studies.BMC Oral Health. 2024 Jun 5;24(1):662. doi: 10.1186/s12903-024-04263-0. BMC Oral Health. 2024. PMID: 38840232 Free PMC article.
-
A high-throughput microfluidic dental plaque biofilm system to visualize and quantify the effect of antimicrobials.J Antimicrob Chemother. 2013 Nov;68(11):2550-60. doi: 10.1093/jac/dkt211. Epub 2013 Jun 25. J Antimicrob Chemother. 2013. PMID: 23800904 Free PMC article.
-
Topical delivery of low-cost protein drug candidates made in chloroplasts for biofilm disruption and uptake by oral epithelial cells.Biomaterials. 2016 Oct;105:156-166. doi: 10.1016/j.biomaterials.2016.07.042. Epub 2016 Aug 2. Biomaterials. 2016. PMID: 27521618 Free PMC article.
References
-
- Auschill, T. M., N. B. Arweiler, L. Netuschil, M. Brecx, E. Reich, A. Sculean, and N. B. Artweiler. 2001. Spatial distribution of vital and dead microorganisms in dental biofilms. Arch. Oral Biol. 46:471-476. - PubMed
-
- Bassler, B. L. 2002. Small talk. Cell-to-cell communication in bacteria. Cell 109:421-424. - PubMed
-
- Coquet, L., G. A. Junter, and T. Jouenne. 1998. Resistance of artificial biofilms of Pseudomonas aeruginosa to imipenem and tobramycin. J. Antimicrob. Chemother. 42:755-760. - PubMed
-
- Fitzgerald, K. A., A. Davies, and A. D. Russell. 1989. Uptake of 14C-chlorhexidine diacetate to Escherichia coli and Pseudomonas aeruginosa and its release by azolectin. FEMS Microbiol. Lett. 51:327-332. - PubMed
Publication types
MeSH terms
Substances
LinkOut - more resources
Full Text Sources
Other Literature Sources
Miscellaneous
