. 2004 Sep 15;104(6):1703-10.
doi: 10.1182/blood-2003-10-3428. Epub 2004 Apr 22.

Impaired platelet responses to thrombin and collagen in AKT-1-deficient mice

Affiliations

Impaired platelet responses to thrombin and collagen in AKT-1-deficient mice

Juhua Chen et al. Blood. .

Abstract

We investigated the role of Akt-1, one of the major downstream effectors of phosphoinositide 3-kinase (PI3K), in platelet function using mice in which the gene for Akt-1 had been inactivated. Using ex vivo techniques, we showed that Akt-1-deficient mice exhibited impaired platelet aggregation and spreading in response to various agonists. These differences were most apparent in platelets activated with low concentrations of thrombin. Although Akt-1 is not the predominant Akt isoform in mouse platelets, its absence diminished the amount of total phospho-Akt and inhibited increases in intracellular Ca(2+) concentration in response to thrombin. Moreover, thrombin-induced platelet alpha-granule release as well as release of adenosine triphosphate from dense granules was also defective in Akt-1-null platelets. Although the absence of Akt-1 did not influence expression of the major platelet receptors for thrombin and collagen, fibrinogen binding in response to these agonists was significantly reduced. As a consequence of impaired alpha(IIb)beta(3) activation and platelet aggregation, Akt-1 null mice showed significantly longer bleeding times than wild-type mice.


Figures

Figure 1
Figure 1
Platelet aggregation in response to thrombin. Platelet aggregation was stimulated with thrombin and optically monitored in a Lumi-Aggregometer. (A) Representative aggregation curves in response to thrombin at 0.04 U/mL (i), 0.1 U/mL (ii), and 0.4 U/mL (iii). Arrows indicate the points of agonist addition. (B) Time from the addition of 0.1 U/mL thrombin to 20%, 35%, 50%, and 55% aggregation in WT ([unk]) and Akt-1–null platelets (○). Means ± SD of 3 independent experiments are shown. (C) WT and Akt-1–null platelets were stimulated with thrombin at 0.04, 0.06, 0.1, 0.4, and 1 U/mL. Bars represent means ± SD of time from addition of agonist to 50% aggregation from 3 independent experiments. (D) Platelets from WT and Akt-1 null mice aggregated by 0.1 U/mL thrombin were visualized using phase contrast microscopy (Leica) and photographed (Micromax). Scale bars equal 20 μm. Images were acquired using a Leica DMIRB phase contrast microscope, objective × 20, and a Micromax RTE/CCD-1300-V-HS camera.
Figure 2
Figure 2
Platelet aggregation in response to collagen, PMA, or ADP. Platelet aggregation was stimulated by collagen (15 μg/mL), PMA (100 nM), or ADP (10 μM) and optically monitored. (A-B) Representative aggregation curves in response to collagen in the presence (A) and absence (B) of 200 μg/mL fibrinogen. Arrows indicate the point of collagen addition. (C) Time from addition of agonist to 40% aggregation in response to ADP, PMA, and collagen. (D) For collagen-induced platelet aggregation, times from agonist addition to the point where light transmission was minimal (as indicated in panel A). For both panels C and D, bars show means ± SD of 3 independent experiments. *Significant difference between WT and Akt-1–null platelets (P < .05).
Figure 3
Figure 3
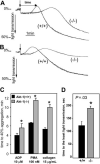
Fibrinogen binding and platelet adhesion. (A) Fibrinogen binding. Platelets were preincubated with ADP (10 μM), PMA (100 nM), and thrombin (0.4 U/mL). FITC-labeled fibrinogen was then added at a final concentration of 300 nM for 30 minutes and fibrinogen binding was analyzed by FACS. A total of 20 000 events per sample was recorded. Bars present MFI ± SD of triplicates from 2 representative experiments. (B) Fibrinogen binding in the presence of LY294002. Platelets from 3 pairs of WT (i,iii) and Akt-1 null (ii,iv) mice were stimulated with thrombin at 0.1 U/mL or 0.5 U/mL, respectively, in the presence or absence of LY294002 (80 μM). FITC-labeled fibrinogen at concentration of 300 nM was added. Fibrinogen binding was analyzed by FACS analysis and 10 000 events per sample were recorded. Gray profiles represent fibrinogen binding in the presence of PGE1; MFIs are shown in response to thrombin in the presence (thin lines) and the absence (thick lines) of LY294002, respectively. Similar results were obtained in an additional 2 experiments. (C-D) Platelet adhesion to collagen. Platelets were resuspended in calcium-free Tyrode buffer containing 2 U/mL apyrase. Platelet suspensions were added to coverslips coated with collagen at 20 μg/mL and incubated for 10 minutes at 37°C. Adherent platelets were fixed and stained with TRITC-phalloidin for actin. The adhesion was visualized and quantified by fluorescence microscopy. Bars present the mean number of platelets (means ± SD) for 6 fields of 3 independent experiments (C). The photograph illustrates adherent or spread platelets in the representative fields (D). * indicates significant difference between WT and Akt-1–null platelets (P < .05). Images were acquired using a Leica DMR fluorescence microscope with a × 100 objective lens, oil, and a × 1.6 zoom adaptor, and a Micromax RTE/CCD-1300-V/HS camera.
Figure 4
Figure 4
Total and phosphorylated Akt. Gel-filtered platelets (1 × 10⁸/mL) were resuspended in the presence of integrin inhibitors to completely block fibrinogen binding. Platelet lysates were subjected to SDS-PAGE and Western blotting using antibodies against all Akt isoforms (Aktpan), phosphorylated Akt (phospho-Aktpan), or actin to ensure equal protein loading. (A) Total Akt levels (top) and their densitometric analysis (bottom) in 2 separate samples of unstimulated platelets. (B) Akt phosphorylation in response to different concentrations of thrombin (top) and densitometric analysis of phosphorylated Akt (bottom). (C) Akt phosphorylation in response to collagen (20 μg/mL) at different time points.
Figure 5
Figure 5
Expression of thrombin and collagen receptors, β3 integrin, and P-selectin, and ATP release. (A-B) Expression of thrombin receptors. Thrombin receptors PAR4 (A) and PAR3 (B) were detected by Western blot. (C) Expression of collagen receptor GPVI. Platelet suspensions were incubated with FITC-labeled anti-GPVI antibody for 15 minutes at room temperature. (D) Expression of β3 integrin. Gel-filtered platelets were incubated with or without thrombin at 0.5 U/mL for 15 minutes and then fixed. After washing, platelets were incubated with anti-β3 integrin antibody for 20 minutes followed by FITC-labeled secondary antibody. (E) P-selectin expression. Platelets were stimulated with or without thrombin at 0.05 U/mL or 0.1 U/mL for 5 minutes and then fixed. After washing, platelets were incubated with FITC-labeled P-selectin antibody for 20 minutes. For panels C-E, the samples were analyzed by flow cytometry; 20 000 events were recorded. Bars present mean ± SD from 3 independent experiments. *Significant difference between WT and Akt-1– null platelets (P < .05). (F) ATP release. The release of ATP was measured in gel-filtered platelets by a Lumi-Aggregometer type 500 VS using luciferin-luciferase. ATP served as the standard in all experiments. The addition of thrombin at a final concentration of 0.05 U/mL is indicated by the arrow (P < .05).
Figure 6
Figure 6
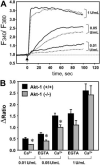
[Ca2+]i measurements. Gel-filtered platelets at 5 × 10⁷/mL were loaded with 2 μM fura-2/AM and resuspended in Tyrode buffer with 1 mM CaCl2 and 1 mM MgCl2. Platelets were stimulated with 0.01, 0.05, or 1 U/mL thrombin and fluorescence signals at excitation wavelengths of 340 and 380 were collected and the 340/380 ratio was analyzed using Felix software from Photon Technology. (A) Representative traces showing changes in F340/F380 ratio in platelets stimulated with 0.01, 0.05, and 1 U/mL thrombin. The solid and dotted lines represent WT and Akt-1–null platelets, respectively. Arrow indicates the point of thrombin addition. Curves were smoothed using the Loess technique with the sampling proportion 0.1 and with the polynomial degree 3 in SigmaPlot 8.0. (B) The average changes in fura-2 ratio (Δratio) in platelets following the addition of thrombin at indicated concentrations in the presence of 0.5 mM EGTA or 1 mM Ca2+. The Δratio was calculated as the difference between the peak ratio after agonist was added, and its level immediately before agonist addition. Data (means ± SD) were summarized from 3 independent experiments. *Significant difference between WT and Akt-1–null platelets (P < .05).
Figure 7
Figure 7
TVBT and volume of shed blood. (A) TVBTs. WT and Akt-1 null mice were anesthetized and tails were amputated at a position where the diameter of the tail was 2.5 mm and immersed in saline. The time from the incision to cessation of bleeding was recorded. Shown is the fraction of tails that are bleeding as a function of time after tail transection. Genotypes and the number of mice of each genotype are indicated. The effect of Akt-1 deficiency on bleeding time was significant by log-rank test (P = .035). (B) Volume of shed blood. The amounts of shed blood during bleeding time test were measured. Bars represent the means ± SE for 12 WT mice and 12 Akt-1 null mice. *Significantly greater amount of shed blood in Akt-1 null mice compared with WT mice (P < .05).

References

    1. Kahn ML, Zheng YW, Huang W, et al. A dual thrombin receptor system for platelet activation. Nature. 1998;394:690–694. - PubMed
    1. Zhang J, Zhang J, Shattil SJ, Cunningham MC, Rittenhouse SE. Phosphoinositide 3-kinase gamma and p85/phosphoinositide 3-kinase in platelets. Relative activation by thrombin receptor or beta-phorbol myristate acetate and roles in promoting the ligand-binding function of alphaIIb-beta3 integrin. J Biol Chem. 1996;271:6265–6272. - PubMed
    1. Watanabe N, Nakajima H, Suzuki H, et al. Functional phenotype of phosphoinositide 3-kinase p85alpha-null platelets characterized by an impaired response to GP VI stimulation. Blood. 2003;102:541–548. - PubMed
    1. Hirsch E, Bosco O, Tropel P, et al. Resistance to thromboembolism in PI3Kgamma-deficient mice. FASEB J. 2001;15:2019–2021. - PubMed
    1. Katso R, Okkenhaug K, Ahmadi K, White S, Timms J, Waterfield MD. Cellular function of phosphoinositide 3-kinases: implications for development, homeostasis, and cancer. Annu Rev Cell Dev Biol. 2001;17:615–675. - PubMed

Publication types

MeSH terms