. 2004 Jul;15(7):3114-22.
doi: 10.1091/mbc.e04-03-0189. Epub 2004 Apr 23.

Selective stimulation of caveolar endocytosis by glycosphingolipids and cholesterol

Affiliations

Selective stimulation of caveolar endocytosis by glycosphingolipids and cholesterol

Deepak K Sharma et al. Mol Biol Cell. 2004 Jul.

Abstract

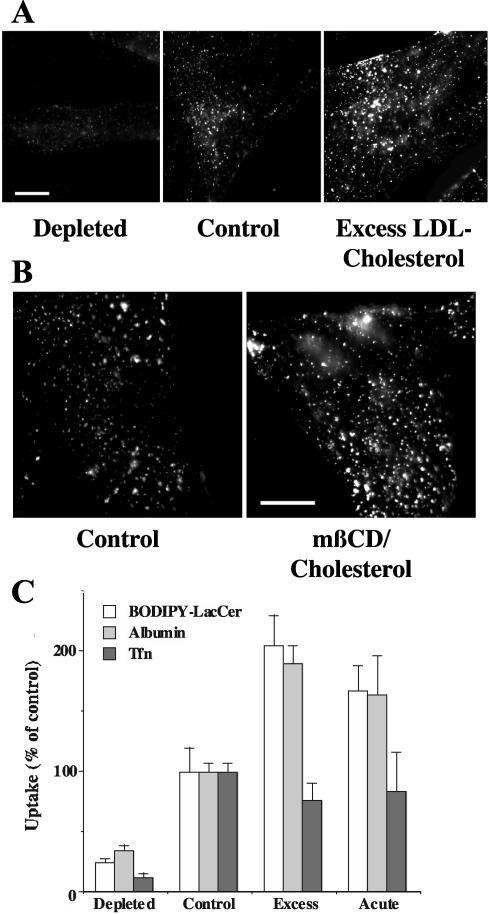
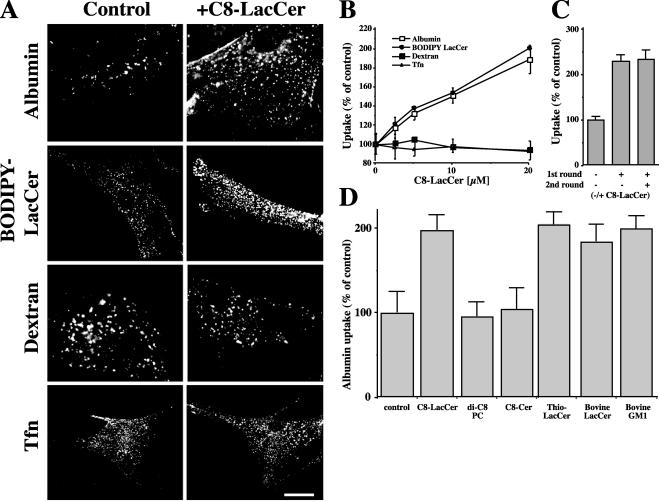
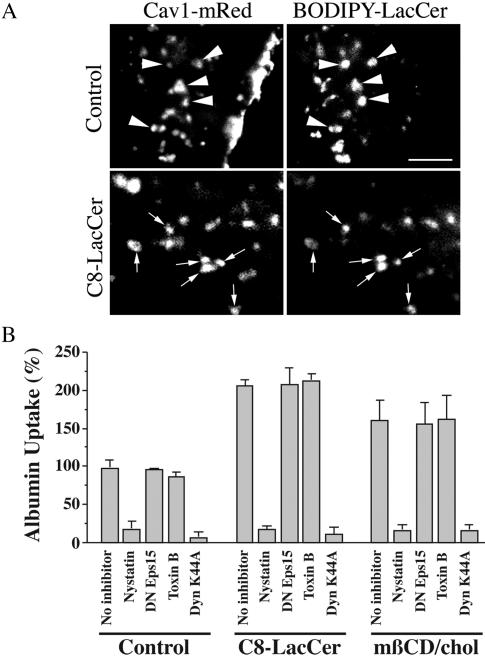
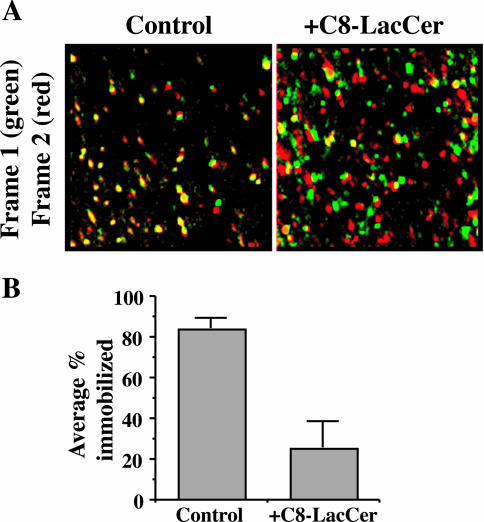
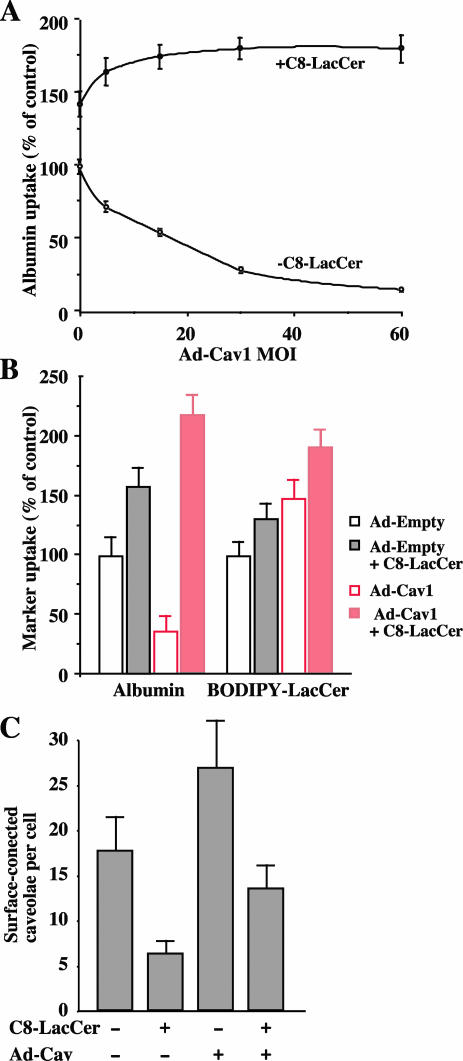
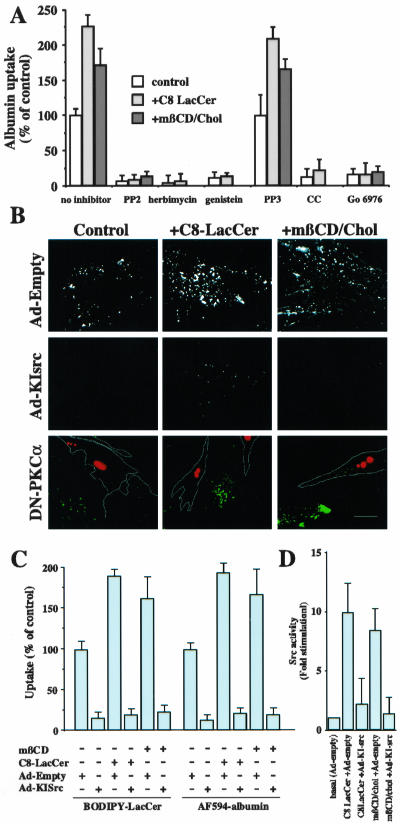
Internalization of some plasma membrane constituents, bacterial toxins, and viruses occurs via caveolae; however, the factors that regulate caveolar internalization are still unclear. Here, we demonstrate that a brief treatment of cultured cells with natural or synthetic glycosphingolipids (GSLs) or elevation of cholesterol (either by acute treatment with mbeta-cyclodextrin/cholesterol or by alteration of growth conditions) dramatically stimulates caveolar endocytosis with little or no effect on other endocytic mechanisms. These treatments also stimulated the movement of GFP-labeled vesicles in cells transfected with caveolin-1-GFP and reduced the number of surface-connected caveolae seen by electron microscopy. In contrast, overexpression of caveolin-1 decreased caveolar uptake, but treatment with GSLs reversed this effect and stimulated caveolar endocytosis. Stimulation of caveolar endocytosis did not occur using ceramide or phosphatidylcholine and was not due to GSL degradation because similar results were obtained using a nonhydrolyzable GSL analog. Stimulated caveolar endocytosis required src kinase and PKC-alpha activity as shown by i) use of pharmacological inhibitors, ii) expression of kinase inactive src or dominant negative PKCalpha, and iii) stimulation of src kinase activity upon addition of GSLs or cholesterol. These results suggest that caveolar endocytosis is regulated by a balance of caveolin-1, cholesterol, and GSLs at the plasma membrane.


Figures

Figure 1.
Figure 1.
Cholesterol positively regulates the uptake of caveolar markers. HSFs were (A) grown under various conditions to obtain cells with low (“depleted”), normal (“control”), or elevated (“excess”) levels of cholesterol or (B) were briefly incubated at 10°C ± mβ-CD/cholesterol to increase PM cholesterol (see MATERIALS AND METHODS). The cells were then incubated with various concentrations (e.g., 5, 2, or 0.6 μM in A) of BODIPY-LacCer for 30 min at 10°C to achieve “equal labeling” of the PM. Samples were then incubated for 5 min at 37°C to initiate endocytosis, chilled to 10°C, and back-exchanged with DF-BSA to remove any fluorescent lipid remaining at the PM (see MATERIALS AND METHODS), and observed under the fluorescence microscope. Bars, 10 μm. (C) HSFs were pulse-labeled with BODIPY-LacCer as in A and B, or with AF594 albumin or AF594-Tfn, and endocytosis was quantified by image analysis. The concentrations of fluorescent albumin or Tfn to achieve “equal loading” of the PM were determined empirically by image analysis. After a subsequent endocytic pulse (5 min at 37°C), noninternalized fluorescence was removed by acid stripping before image analysis to quantify uptake. All values are normalized to untreated control samples. At least 15 cells were quantified for each condition in three or more independent experiments.
Figure 2.
Figure 2.
Pretreatment of HSFs with C8-LacCer stimulates the uptake of fluorescent albumin or BODIPY-LacCer, but not fluorescent dextran or Tfn. (A) HSFs were coincubated with 20 μM C8-LacCer/BSA or BSA alone (Control) and the indicated fluorescent marker for 30 min at 10°C, washed, and further incubated for 5 min at 37°C (see MATERIALS AND METHODS). Samples were then cooled to 10°C and back-exchanged (for BODIPY-LacCer) or acid-stripped before fluorescence microscopy. Bar, 10 μm. (B) Experiments were performed as in A except that the concentration of C8-LacCer was varied. Internalization of indicated marker after 5 min at 37°C was quantified by image analysis. Values are expressed as % relative to control cells that were not treated with C8-LacCer. (C) Cells were incubated through a first round with 1 μM BODIPY-LacCer without (-) or with (+) 20 μM C8-LacCer for 30 min at 4°C followed by 5 min at 37°C as in A. Samples were then rinsed and incubated through a second round (30 min at 4°C followed by 5 min at 37°C) with or without 20 μM C8-LacCer. For incubations without C8-LacCer, cells were incubated with vehicle alone (i.e., 20 μM BSA). (D) Stimulation of albumin uptake by C8-LacCer vs. other lipids. HSFs were coincubated as in A with the indicated natural or synthetic lipid (20 μM) and the internalization of AF594-albumin evaluated after 5 min at 37°C. Results in B and C are expressed as % internalization relative to control cells. Values are mean ± SD (20 cells for each experimental condition; 3 independent experiments).
Figure 3.
Figure 3.
Pretreatment with C8-LacCer or mβ-CD/cholesterol does not alter the mechanism of albumin internalization in HSFs. (A) HSFs were transfected with Cav1-mRed and incubated for 30 min at 10°C without (control) or with C8-LacCer in the presence of 1 μM BODIPY-LacCer. The cells were then rinsed and further incubated for 30 s at 37°C, cooled to 10°C, and back-exchanged with defatted BSA as in Figure 1 to remove any BODIPY-LacCer that was not internalized. Cav1-mRed and BODIPY-LacCer were then imaged in red and green channels, respectively. Bar, 2 μm. (B) Cells were untreated (no inhibitor) or treated with C8-LacCer/BSA or mβ-CD/cholesterol as in Figures 1 and 2, and the uptake of AF594-albumin was quantified after 5 min of internalization at 37°C. To assess the mechanism of internalization, cells were pretreated with nystatin, Clostridium dificile Toxin B, transfected with DN Eps15-GFP, or infected with Ad-DynK44A. Data are expressed relative to the value obtained in the absence of inhibitors for the untreated Control sample. Note that pretreatment with C8-LacCer or mβ-CD/cholesterol stimulated albumin uptake, but did not affect the inhibition (or lack of inhibition) by the various inhibitors. Values are mean ± SD (10 cells for each experimental condition; 5 independent experiments).
Figure 4.
Figure 4.
C8-LacCer stimulates the movement of Cav1-GFP. HSFs were transfected with Cav1-GFP and incubated for 30 min at 10°C without (Control) or with C8-LacCer. The samples were then warmed to 37°C and fluorescence images acquired every second for 1 min. See Supplemental Data. (A) Sequential frames were rendered in pseudocolor (frame 1, green; frame 2, red) and then merged. Yellow puncta indicate immobile structures, whereas green and red puncta indicate Cav1-GFP that has moved between frames. Note the high fraction of yellow puncta in the Control cells relative to the +C8-LacCer-treated sample. (B) Successive frames were examined as in A and the % of fluorescent puncta in the overlay images which were immobile (i.e., yellow) was quantified.
Figure 5.
Figure 5.
Cav1 overexpression attenutates caveolar endocytosis in HeLa cells, but this effect is overcome by treatment with C8-LacCer. (A) Cells were infected with Ad-Cav1 at various MOI for 24 h. The cells were then incubated with AF594 albumin without (○) or with C8-LacCer/BSA (•) for 5 min at 37°C as in Figure 2, and the uptake was quantified by image analysis. All values are relative to the uptake obtained in the absence of C8-LacCer treatment using cells that were not infected with Ad-Cav1. (B) Cells were incubated with Ad-Empty or Ad-Cav1 virus at an MOI of 30 for 24 h and then incubated with AF594 albumin or BODIPY-LacCer as in Figure 2. Values for each marker are quantified relative to control values obtained using cells infected with Ad-empty virus. Values are mean ± SD (≥10 cells for each experimental condition; 3 independent experiments). (C) Cells were infected with Ad-Empty or Ad-Cav1, followed by incubations with BSA or C8-LacCer/BSA at 10°C. Samples were then warmed for 5 min at 37°C, fixed, stained with Ruthenium Red, and embedded for electron microscopy. Cells were sectioned parallel to the substratum through the nucleus and 20 random profiles from different cells were examined for each treatment in a blinded study. The number of surface connected caveolae were quantified and plotted for each experimental condition (see MATERIALS AND METHODS).
Figure 6.
Figure 6.
C8-LacCer or mβ-CD/cholesterol stimulation of endocytosis in human skin fibroblasts is dependent on src and PKC-α. (A) Uptake of AF594 albumin (5 min at 37°C) was assessed in the absence or presence of the src kinase inhibitors, PP2 (PP3 is a negative control for PP2), herbimycin, or genestein, or the PKC inhibitors, chelerytherine chloride (CC) or Gö 6976. Values are expressed as % of uptake in untreated control cells. (B) Inhibition of stimulated endocytosis by Ad-KI-Src and DN-PKC-α. Cells were infected with Ad-empty or Ad-KI-src for 24 h or cotransfected with DsRed-Nuc and DN-PKC-α (cells outlined in white) for 24 h. Samples were subsequently incubated with or without C8-LacCer or mβ-CD/cholesterol and AF594-albumin for 5 min at 37°C as in Figure 2. Bar, 10 μm. (C) Quantitation of inhibition of stimulated endocytosis by Ad-KI-Src. Cells were infected with Ad-KI src or Ad-empty for 24 h and subsequently treated with C8-LacCer or mβCD/cholesterol (see Figures 1 and 2). Internalization of AF594-albumin or BODIPY-LacCer internalization (5 min at 37°C) was then quantified by image analysis. (D) C8-LacCer and cholesterol stimulate src kinase activity. Cells were infected with Ad-KI src or Ad-empty and subsequently treated with C8-LacCer or mβCD/Cholesterol as C. Cells were then lysed and src kinase activity was quantified by measuring the phosphorylation of a src peptide substrate (see MATERIALS AND METHODS). In A and C, values are the means ± SD (≥10 cells per experimental condition; 3 independent experiments). In D, values are means ± SD, expressed as fold stimulation over basal measurements obtained for Ad-empty infected cells without C8-LacCer or cholesterol treatment.

Similar articles

Cited by

References

    1. Aktories, K., Schmidt, G., and Just, I. (2000). Rho GTPases as targets of bacterial protein toxins. Biol. Chem. 381, 421-426. - PubMed
    1. Albrecht, B., Putz, U., and Schwarzmann, G. (1995). Synthesis of fluorescent and radioactive analogues of two lactosylceramides and glucosylceramide containing b-thioglycosidic bonds that are resistant to enzymatic degradation. Carbohydrate Res. 276, 289-308. - PubMed
    1. Benmerah, A., Bayrou, M., Cerf-Bensussan, N., and Dautry-Varsat, A. (1999). Inhibition of clathrin-coated pit assembly by an Eps15 mutant. J. Cell Sci. 112, 1303-1311. - PubMed
    1. Campbell, R.E., Tour, O., Palmer, A.E., Steinbach, P.A., Baird, G.S., Zacharias, D.A., and Tsien, R.Y. (2002). A monomeric red fluorescent protein. Proc. Natl. Acad. Sci. USA 99, 7877-7882. - PMC - PubMed
    1. Carver, L.A., and Schnitzer, J.E. (2003). Caveolae: mining little caves for new cancer targets. Nat. Rev. Cancer 3, 571-581. - PubMed

Publication types

MeSH terms