

Comparison of simultaneously recorded [H2(15)O]-PET and LORETA during cognitive and pharmacological activation
- PMID: 15108296
- PMCID: PMC6871957
- DOI: 10.1002/hbm.20015
Comparison of simultaneously recorded [H2(15)O]-PET and LORETA during cognitive and pharmacological activation
Abstract
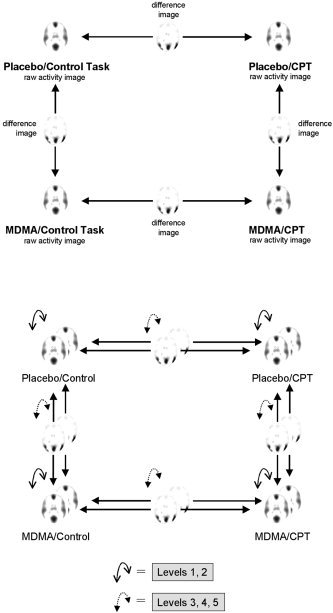
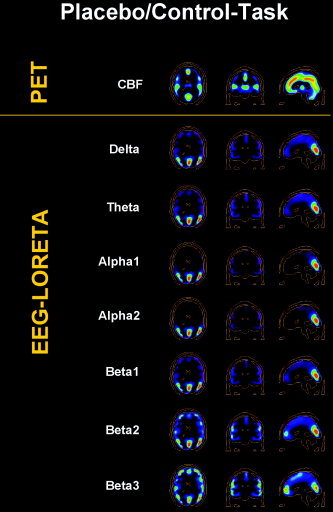
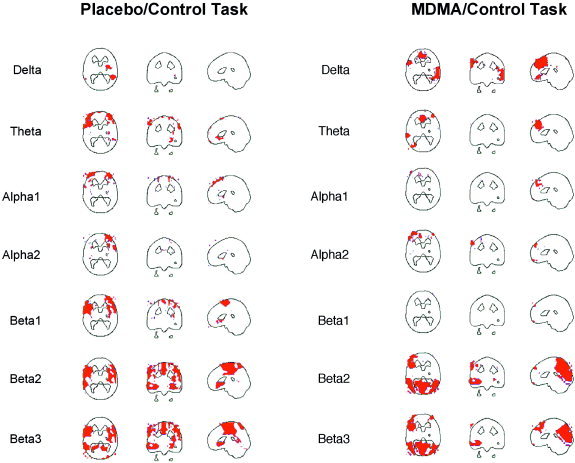
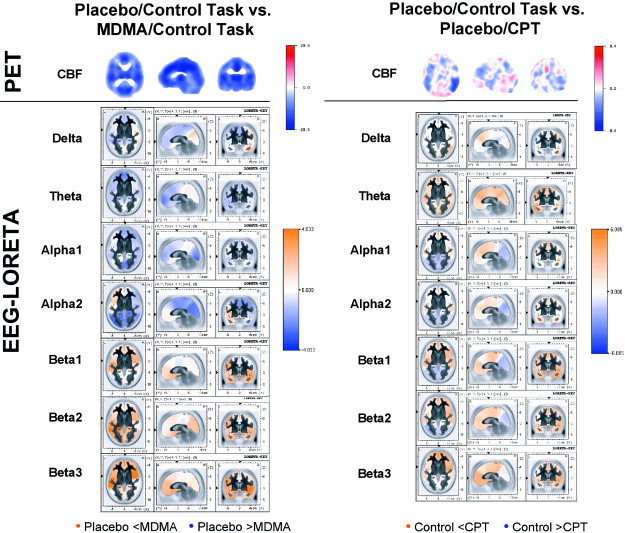
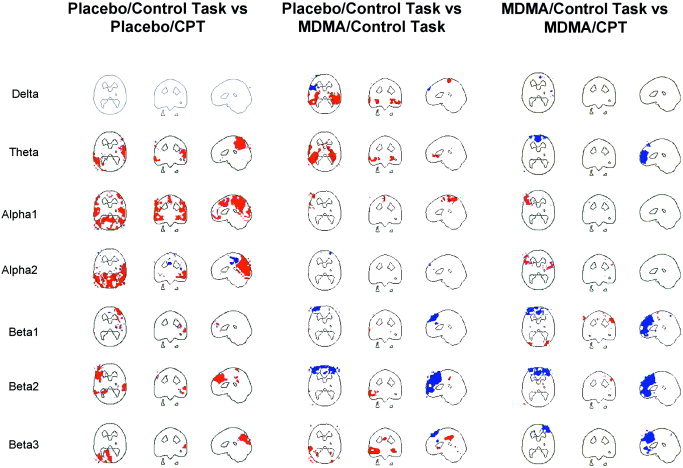
The complementary strengths and weaknesses of established functional brain imaging methods (high spatial, low temporal resolution) and EEG-based techniques (low spatial, high temporal resolution) make their combined use a promising avenue for studying brain processes at a more fine-grained level. However, this strategy requires a better understanding of the relationship between hemodynamic/metabolic and neuroelectric measures of brain activity. We investigated possible correspondences between cerebral blood flow (CBF) as measured by [H2O]-PET and intracerebral electric activity computed by Low Resolution Brain Electromagnetic Tomography (LORETA) from scalp-recorded multichannel EEG in healthy human subjects during cognitive and pharmacological stimulation. The two imaging modalities were compared by descriptive, correlational, and variance analyses, the latter carried out using statistical parametric mapping (SPM99). Descriptive visual comparison showed a partial overlap between the sets of active brain regions detected by the two modalities. A number of exclusively positive correlations of neuroelectric activity with regional CBF were found across the whole EEG frequency range, including slow wave activity, the latter finding being in contrast to most previous studies conducted in patients. Analysis of variance revealed an extensive lack of statistically significant correspondences between brain activity changes as measured by PET vs. EEG-LORETA. In general, correspondences, to the extent they were found, were dependent on experimental condition, brain region, and EEG frequency.
Copyright 2004 Wiley-Liss, Inc.
Figures
Similar articles
-
An H(2) (15)O-PET study of cerebral blood flow changes during focal epileptic discharges induced by intracerebral electrical stimulation.Brain. 1999 Oct;122 ( Pt 10):1851-65. doi: 10.1093/brain/122.10.1851. Brain. 1999. PMID: 10506088
-
Three-dimensional localization of abnormal EEG activity in migraine: a low resolution electromagnetic tomography (LORETA) study of migraine patients in the pain-free interval.Brain Topogr. 2008 Sep;21(1):36-42. doi: 10.1007/s10548-008-0061-6. Epub 2008 Aug 5. Brain Topogr. 2008. PMID: 18679787
-
Characterization of dynamic 3-D PET imaging for functional brain mapping.IEEE Trans Med Imaging. 1997 Jun;16(3):261-9. doi: 10.1109/42.585760. IEEE Trans Med Imaging. 1997. PMID: 9184888
-
Human brain mapping: hemodynamic response and electrophysiology.Clin Neurophysiol. 2008 Apr;119(4):731-43. doi: 10.1016/j.clinph.2007.10.026. Epub 2008 Jan 9. Clin Neurophysiol. 2008. PMID: 18187361 Review.
-
[EEG source localization using LORETA (low resolution electromagnetic tomography)].Ideggyogy Sz. 2011 Mar 30;64(3-4):110-8. Ideggyogy Sz. 2011. PMID: 21545008 Review. Hungarian.
Cited by
-
Resistor mesh model of a spherical head: part 2: a review of applications to cortical mapping.Med Biol Eng Comput. 2005 Nov;43(6):703-11. doi: 10.1007/BF02430946. Med Biol Eng Comput. 2005. PMID: 16594295
-
Towards neural correlates of auditory stimulus processing: a simultaneous auditory evoked potentials and functional magnetic resonance study using an odd-ball paradigm.Med Sci Monit. 2014 Jan 13;20:35-46. doi: 10.12659/MSM.889712. Med Sci Monit. 2014. PMID: 24413019 Free PMC article.
-
Psychophysiological responses of artificial gravity exposure to humans.Eur J Appl Physiol. 2014 Oct;114(10):2061-71. doi: 10.1007/s00421-014-2927-5. Epub 2014 Jun 17. Eur J Appl Physiol. 2014. PMID: 24934228
-
Demonstrating test-retest reliability of electrophysiological measures for healthy adults in a multisite study of biomarkers of antidepressant treatment response.Psychophysiology. 2017 Jan;54(1):34-50. doi: 10.1111/psyp.12758. Psychophysiology. 2017. PMID: 28000259 Free PMC article.
-
Why Some People Discount More than Others: Baseline Activation in the Dorsal PFC Mediates the Link between COMT Genotype and Impatient Choice.Front Neurosci. 2012 May 7;6:54. doi: 10.3389/fnins.2012.00054. eCollection 2012. Front Neurosci. 2012. PMID: 22586360 Free PMC article.
References
-
- Allen PJ, Josephs O, Turner R (2000): A method for removing imaging artifact from continuous EEG recorded during functional MRI. Neuroimage 12: 230–239. - PubMed
-
- Buchan RJ, Nagata K, Yokoyama E, Langman P, Yuya H, Hirata Y, Hatazawa J, Kanno I (1997): Regional correlations between the EEG and oxygen metabolism in dementia of Alzheimer's type. Electroencephalogr Clin Neurophysiol 103: 409–417. - PubMed
-
- Buchsbaum MS, Kessler R, King A, Johnson J, Cappelletti J (1984): Simultaneous cerebral glucography with positron emission tomography and topographic electroencephalography In: Pfurtscheller G, Jonkman EJ, Lopes da Silva FH, editors. Brain ischemia : quantitative EEG and imaging techniques. Amsterdam: Elsevier Science Publishers B.V; p. 263–269. - PubMed
-
- Friston KJ, Ashburner J, Frith CD, Poline JB, Heather JD, Frackowiak RJS (1996): Spatial registration and normalization of images. Hum Brain Mapping 2: 165–189.
Publication types
MeSH terms
LinkOut - more resources
Full Text Sources
