

Noninvasive optical imaging in the visual cortex in young infants
- PMID: 15108300
- PMCID: PMC6871980
- DOI: 10.1002/hbm.20020
Noninvasive optical imaging in the visual cortex in young infants
Abstract
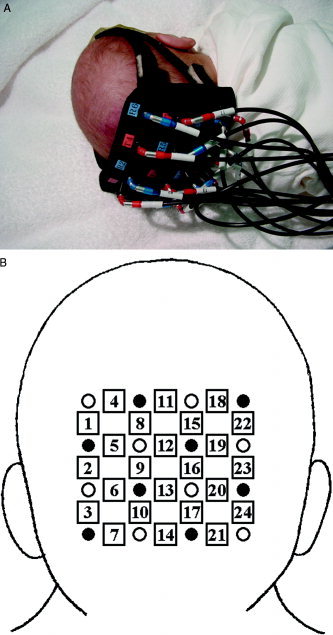
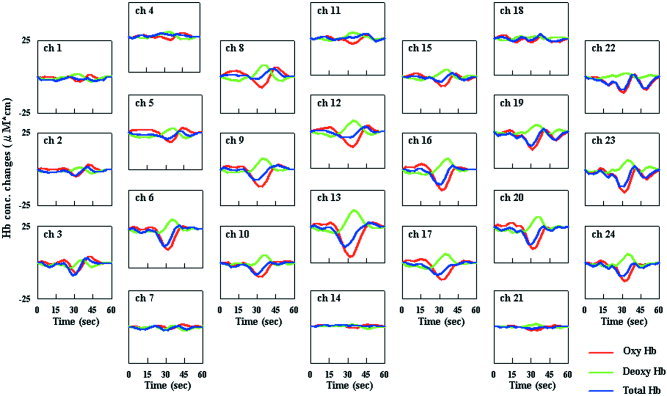
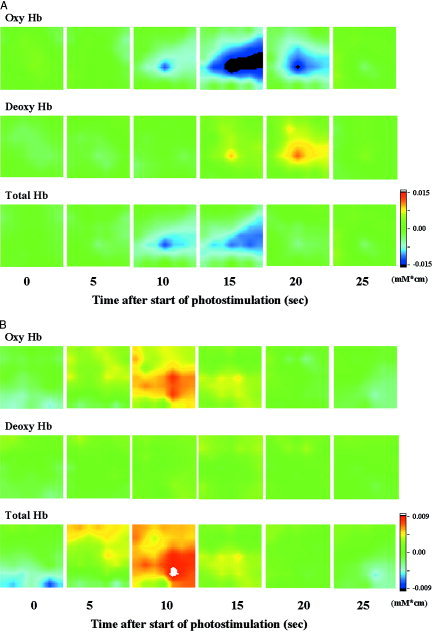
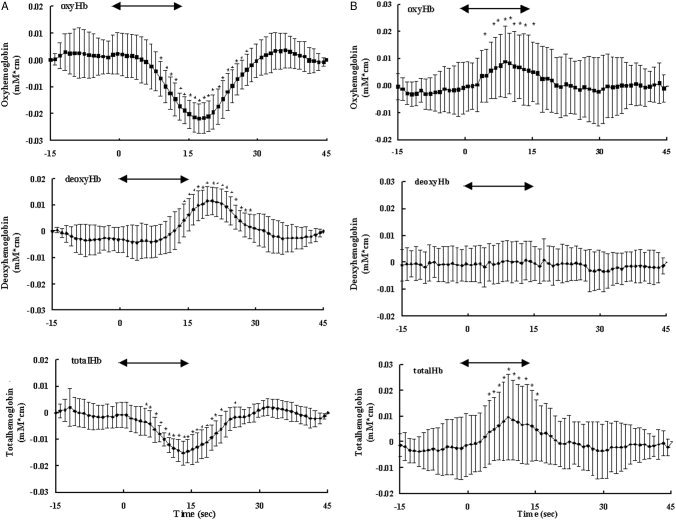
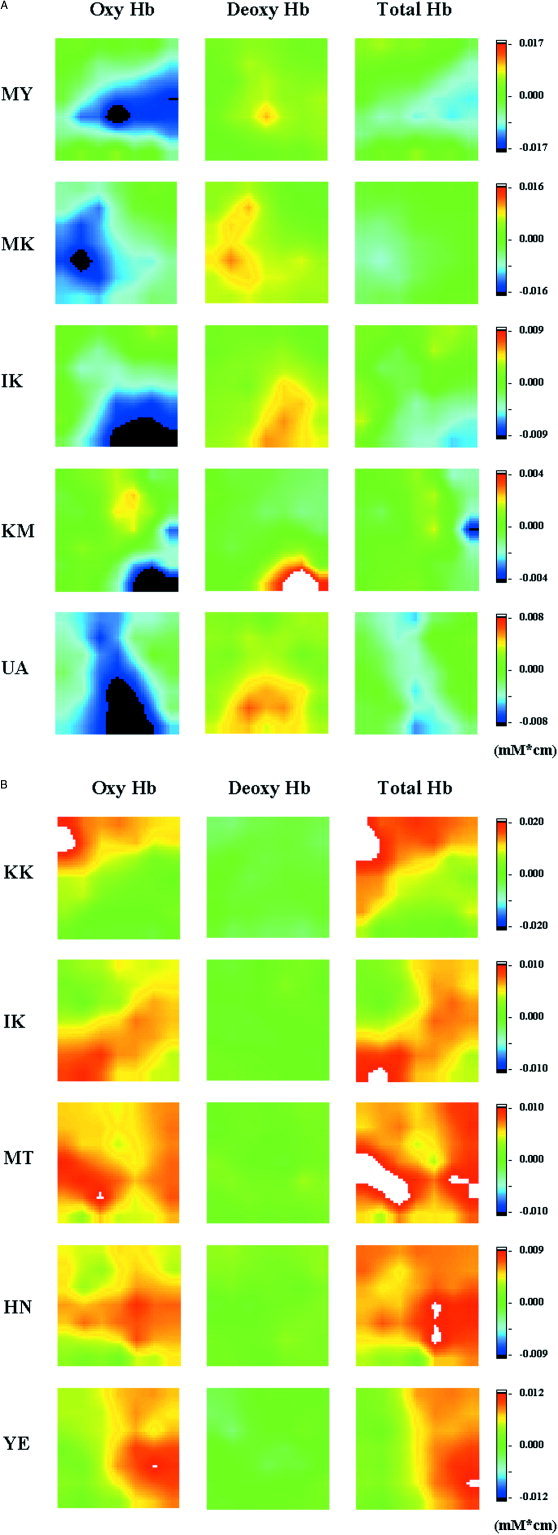
During the developmental stage, the brain undergoes anatomic, functional, and metabolic changes necessary to support the complex adaptive behavior of a mature individual. Estimation of developmental changes occurring in different regions of the brain would provide a means of relating various behavioral phenomena to maturation-specific brain structures, thereby providing useful information on structure-function relationships in both normal and disease states. We used multichannel near-infrared spectroscopy (MNIRS), a new noninvasive imaging technique for revealing the course of neural activity in selected brain regions, to monitor the activities of the visual cortex as mirrored by hemodynamic responses in infants subjected to photostimulation during natural sleep. In the infants, oxyhemoglobin and total hemoglobin decreased and deoxyhemoglobin increased in the visual cortex with photostimulation. This pattern of responses was different from the response pattern in adults reported previously. The different patterns of responses to photostimulation in the visual cortices of infants and adults might reflect developmental and behavioral differences. It may reflect a different functional organization of the visual cortex in infants or ongoing retinal development. Our results demonstrated that regional hemodynamic change could be detected in a small area around the visual cortex. MNIRS offers considerable potential for research and noninvasive clinical applications.
Copyright 2004 Wiley-Liss, Inc.
Figures
Similar articles
-
Hemodynamic response to visual stimulation in newborn infants using functional near-infrared spectroscopy.Hum Brain Mapp. 2008 Apr;29(4):453-60. doi: 10.1002/hbm.20411. Hum Brain Mapp. 2008. PMID: 17525986 Free PMC article.
-
Different time evolution of oxyhemoglobin and deoxyhemoglobin concentration changes in the visual and motor cortices during functional stimulation: a near-infrared spectroscopy study.Neuroimage. 2002 Jul;16(3 Pt 1):704-12. doi: 10.1006/nimg.2002.1128. Neuroimage. 2002. PMID: 12169254
-
Functional lateralization of sensorimotor cortex in infants measured using multichannel near-infrared spectroscopy.Pediatr Res. 2011 May;69(5 Pt 1):430-5. doi: 10.1203/PDR.0b013e3182125cbd. Pediatr Res. 2011. PMID: 21283052
-
Neonatal intensive care applications of near-infrared spectroscopy.Clin Perinatol. 1999 Dec;26(4):893-903, ix. Clin Perinatol. 1999. PMID: 10572728 Review.
-
Near-infrared spectroscopy as a hemodynamic monitor in critical illness.Pediatr Crit Care Med. 2011 Jul;12(4 Suppl):S27-32. doi: 10.1097/PCC.0b013e318221173a. Pediatr Crit Care Med. 2011. PMID: 22129547 Review.
Cited by
-
The cerebral hemodynamic response to phonetic changes of speech in preterm and term infants: The impact of postmenstrual age.Neuroimage Clin. 2018 May 15;19:599-606. doi: 10.1016/j.nicl.2018.05.005. eCollection 2018. Neuroimage Clin. 2018. PMID: 29984167 Free PMC article.
-
In mice and humans, brain microvascular contractility matures postnatally.Brain Struct Funct. 2023 Mar;228(2):475-492. doi: 10.1007/s00429-022-02592-w. Epub 2022 Nov 16. Brain Struct Funct. 2023. PMID: 36380034
-
Functional near-infrared spectroscopy studies in children.Biopsychosoc Med. 2012 Mar 20;6:7. doi: 10.1186/1751-0759-6-7. Biopsychosoc Med. 2012. PMID: 22433235 Free PMC article.
-
Near-infrared spectroscopy: a report from the McDonnell infant methodology consortium.Dev Cogn Neurosci. 2011 Jan;1(1):22-46. doi: 10.1016/j.dcn.2010.07.004. Epub 2010 Aug 4. Dev Cogn Neurosci. 2011. PMID: 22436417 Free PMC article. Review.
-
Functional near-infrared spectroscopy in pediatric clinical research: Different pathophysiologies and promising clinical applications.Neurophotonics. 2023 Apr;10(2):023517. doi: 10.1117/1.NPh.10.2.023517. Epub 2023 Mar 3. Neurophotonics. 2023. PMID: 36873247 Free PMC article.
References
-
- Atkinson J (1984): Human visual development over the first 6 months of life. A review and a hypothesis. Hum Neurobiol 3: 61–74. - PubMed
-
- Bartocci M, Winberg J, Ruggiero C, Bergqvist LL, Serra G, Lagercrantz H (2000): Activation of olfactory cortex in newborn infants after odor stimulation: a functional near‐infrared spectroscopy study. Pediatr Res 48: 18–23. - PubMed
-
- Born P, Rostrup E, Leth H, Peitersen B, Lou HC (1996): Change of visually induced cortical activation patterns during development. Lancet 347: 543. - PubMed
-
- Born P, Leth H, Miranda M, Rostrup E, Stensgaard A, Peitersen B, Larsson HB, Lou HC (1998): Visual activation in infants and young children studied by functional magnetic resonance imaging. Pediatr Res 44: 578–583. - PubMed
-
- Born AP, Rostrup E, Miranda MJ, Larsson HB, Lou HC (2002a): Visual cortex reactivity in sedated children examined with perfusion MRI (FAIR). Magn Reson Imaging 20: 199–205. - PubMed
Publication types
MeSH terms
Substances
LinkOut - more resources
Full Text Sources
