. 2004 May;164(5):1817-26.
doi: 10.1016/S0002-9440(10)63740-6.

Persistent proteinuria up-regulates angiotensin II type 2 receptor and induces apoptosis in proximal tubular cells

Affiliations

Persistent proteinuria up-regulates angiotensin II type 2 receptor and induces apoptosis in proximal tubular cells

Nuria Tejera et al. Am J Pathol. 2004 May.

Abstract

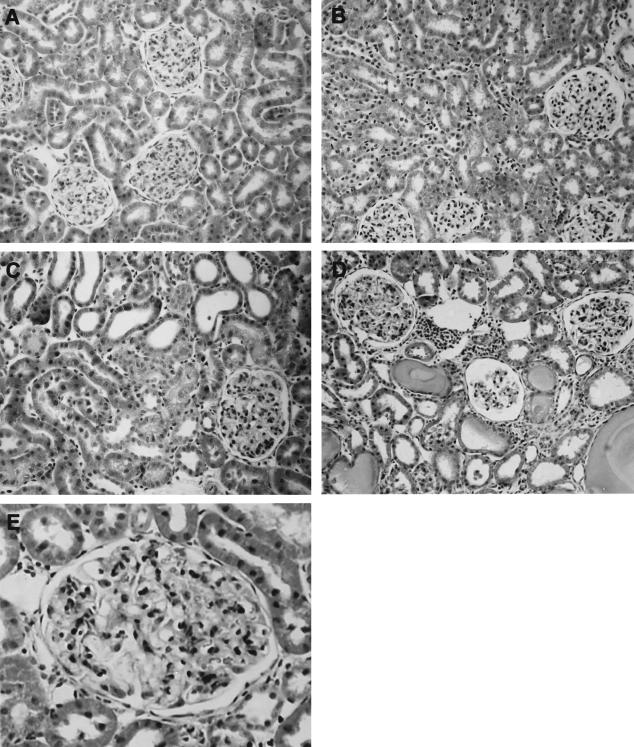
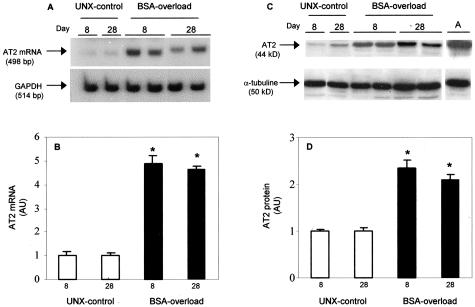
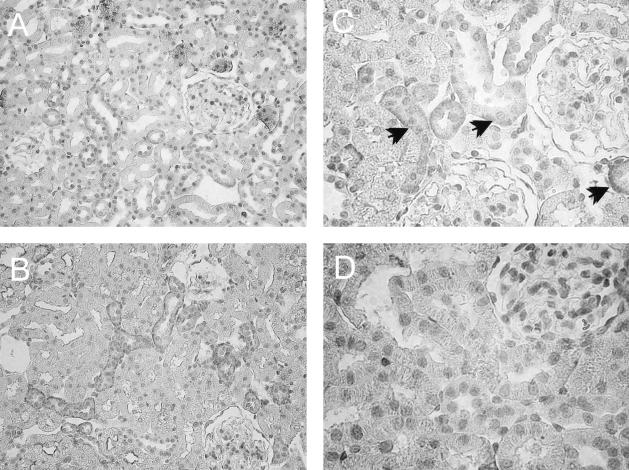
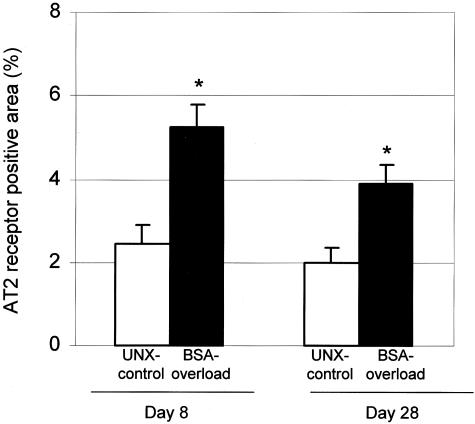
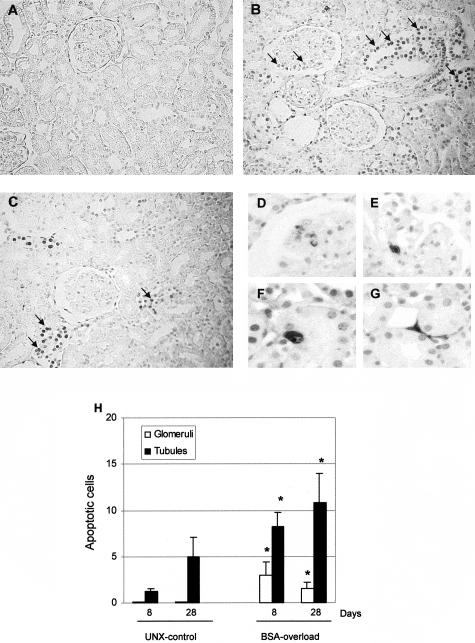
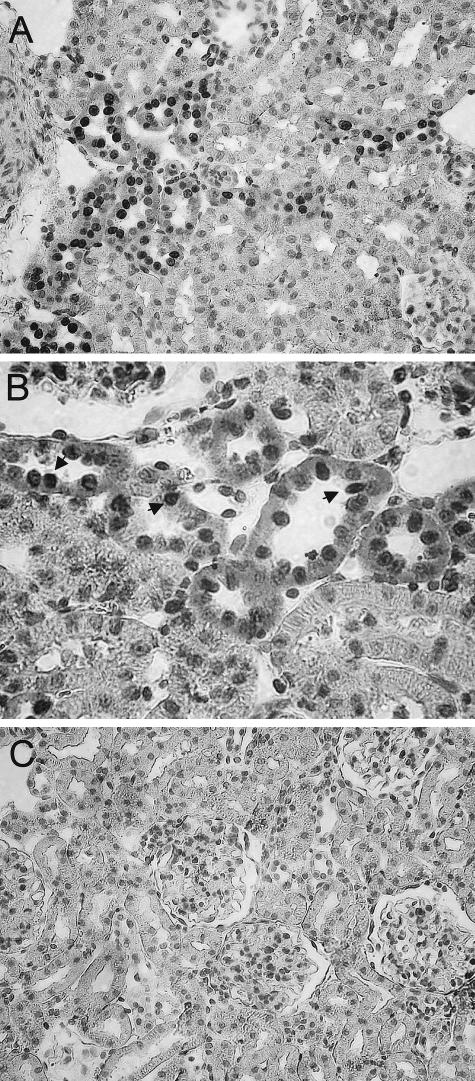
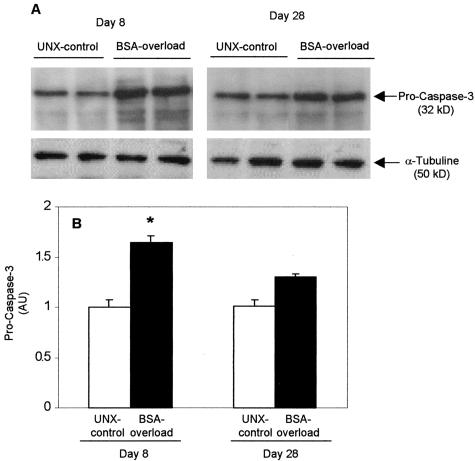
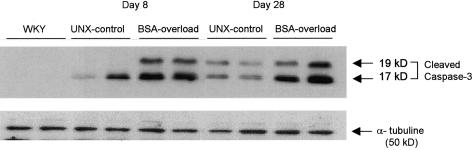
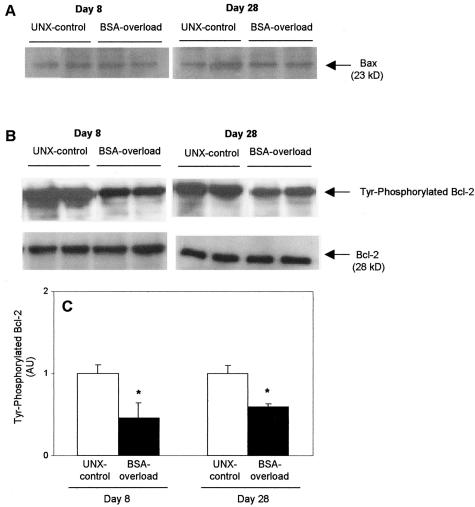
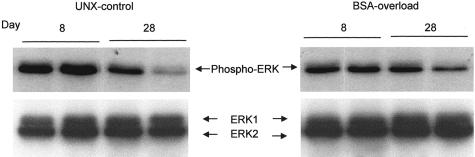
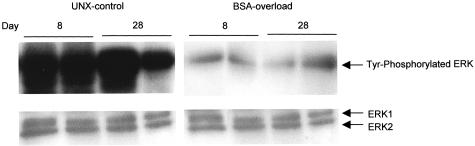
Apoptosis is implicated in the progressive cell loss and fibrosis both at glomerular and tubulointerstitial level. In this study, we examined the potential mechanisms by which persistent proteinuria (protein-overload model) could induce apoptosis. After uninephrectomy (UNX), Wistar rats received daily injections of 0.5 g of bovine serum albumin (BSA)/100 g body weight or saline. Both at day 8 and day 28, rats receiving BSA had proteinuria and renal lesions characterized by tubular atrophy and/or dilation and mononuclear cell infiltration. In relation to control-UNX rats, renal cortex of nephritic rats showed an increment in AT2 mRNA (reverse transcriptase-polymerase chain reaction) and protein (Western blot) expression. In both groups, AT2 receptor immunostaining was mainly localized in proximal tubular cells. Rats with persistent proteinuria showed a significantly increased number of terminal dUTP nick-end labeling positive apoptotic cells compared with UNX-controls, both in glomeruli and tubulointerstitium. Double staining for apoptosis and AT2 receptor showed that most terminal dUTP nick-end labeling positive cells were found in tubules expressing AT2 receptor. Using an antibody that recognizes the active form caspase-3, we observed an increment in caspase-3 activation in rats receiving BSA with respect to those receiving saline. Rats with persistent proteinuria showed a diminution in the phosphorylation of Bcl-2 with respect to UNX-controls both at day 8 and day 28. By contrast, no changes were observed either in the Bax or in the Bcl-2 protein levels. The administration of BSA to UNX rats induced a diminution in the phosphorylation of ERK with respect to UNX-control at all times studied. The changes observed in ERK activities took place without alterations of ERK1/2 protein levels. In summary, our data suggest that persistent proteinuria causes apoptosis in tubular cells through the activation of AT2 receptor, which can, in turn, inhibit MAP kinase (ERK1/2) activation and Bcl-2 phosphorylation.


Figures

Figure 1
Figure 1
Histological analysis of renal tissue from UNX-control (A, B) and BSA-overloaded rats (C–E). The sections were stained with Masson’s trichrome. No significant tubulointerstitial lesions were observed in animals receiving saline (UNX-controls) either at day 8 (A) or day 28 (B). By contrast, animals receiving 0.5 g/100 g body weight BSA during 8 (C) and 28 (D) days showed interstitial infiltrate, tubular atrophy and/or vacuolization, and protein casts within the tubules. E: Detail of mesangial expansion observed in BSA-overloaded rats at day 28. Photographs are representative of seven animals per group. Original magnifications: ×200 (A–D); ×400 (E).
Figure 2
Figure 2
Expression of AT2 receptor mRNA (A, B) and protein (C, D) in renal cortex of UNX-control and BSA-overloaded rats. Autoradiography showing AT2 receptor mRNA expression (A) and protein production (C) of representative animals from each group. B and D: Densitometric analysis of AT2 receptor bands from rats receiving saline (UNX-control, □) and BSA-overloaded rats (▪). Results are expressed as fold-increase compared with UNX-control at day 8. Individual bar values are mean ± SEM of each group, n = 7 animals per group. *, P < 0.001 with respect to rats receiving saline (UNX-control) at same time. Adrenal gland extracts (A) were used as a positive control. AU, arbitrary units.
Figure 3
Figure 3
Localization of AT2 receptor in paraffin-embedded kidney sections from UNX-control (A) and BSA-overloaded rats (B) at day 8. In both groups of rats, the AT2 receptor staining was localized in proximal and distal tubules. Neither UNX-control nor BSA-overloaded rats showed appreciable immunostaining of AT2 receptor in glomeruli. C: Detail of the AT2 receptor staining localized mainly in basolateral membranes (arrows). D: No staining was observed in renal sections from BSA-overloaded rats at day 8 incubated with a nonimmune normal rabbit serum. Original magnifications: ×200 (A, B); ×400 (C, D).
Figure 4
Figure 4
Percentage of renal cortex occupied by AT2 receptor immunostaining. AT2 receptor immunostaining was quantified as described in Materials and Methods. Results as mean ± SEM, n = 7 animals per group. *, P < 0.05 with respect to UNX-control at same time.
Figure 5
Figure 5
Detection of apoptotic cells by in situ DNA TUNEL in renal tissue from UNX-control and BSA-overloaded rats. TUNEL staining was performed in kidney sections from UNX-control (A) and BSA-overloaded rats at day 8 (B) and day 28 (C). A representative area from each section is shown. An increment in apoptotic cells (arrows) was observed in renal sections from BSA-overloaded animals in comparison with those receiving saline (UNX-control). D: At day 8, BSA-overloaded rats only showed condensed pyknotic nuclei with apoptotic bodies in some glomeruli. At day 28, cells with condensed pyknotic nuclei with apoptotic bodies were mainly localized in glomeruli (E), tubules (F), and interstitium (G). H: Quantitation of TUNEL-positive cells in glomeruli and tubules. Data represent mean ± SEM, n = 7 animals per group. *, P < 0.05 with respect to UNX-control at same time.
Figure 6
Figure 6
Co-localization of apoptosis and AT2 receptor in renal sections of BSA-overloaded rats at day 8. Most of the TUNEL-positive cells (brown) (arrows) were found in tubules expressing AT2 receptor (red) (A, B). C: No staining was observed in renal sections incubated with a nonimmune normal rabbit serum and with the omission of TdT enzyme. Original magnifications: ×200 (A, C); ×400 (B).
Figure 7
Figure 7
Procaspase-3 expression is increased in renal cortex from BSA-overloaded rats. A: Western blot results showing two representative animals from each group. B: Densitometric results expressed as fold-increase compared to rats receiving saline (UNX-control) at day 8. Individual bar values are mean ± SEM of each group, n = 7 animals per group. *, P < 0.05 with respect to UNX-control at same time. AU, arbitrary units.
Figure 8
Figure 8
Caspase-3 active subunit (17 to 20 kd) expression is increased in renal cortex from BSA-overloaded rats. Western blot showing two representative animals from each group. Two proteins of Mr 17 kd (large subunit) and 19 kd (prodomain + large subunit) are identified both in UNX-control and BSA-overloaded rats.
Figure 9
Figure 9
Expression of Bax and Bel-2 proteins from UNX-control and BSA-overloaded rats. A: BSA overload did not alter the protein expression of Bax. B: However, BSA-overloaded rats showed a diminution in the phosphorylation of Bcl-2 with respect to those receiving saline (UNX-controls) both at day 8 and day 28 (top). Reprobing of immunoblots with an anti-Bcl-2 antibody demonstrated no changes in total Bcl-2 protein production. Autoradiographies are representative of seven animals per group (bottom). C: Densitometric analysis of phosphorylated Bcl-2 bands. Data are expressed as fold-increase with respect to rats receiving saline and represent mean ± SEM of each group, n = 7 animals per group. *, P < 0.05 with respect to UNX-control at same time. AU, arbitrary units.
Figure 10
Figure 10
MAP kinase (ERK1/ERK2) expression in renal cortex from UNX-control and BSA-overloaded rats. Renal cortex lysates were examined by an anti-phospho-ERK1/2 antibody that identifies only ERK forms phosphorylated within the regulatory sequence. Confirmation of equal loading was performed by reprobing of immunoblots with an anti-total ERK antibody. Autoradiographies show two representative animals from each group.
Figure 11
Figure 11
Phosphorylation of MAP kinases (ERK1/ERK2) detected by immunoprecipitation in renal cortex from UNX-control and BSA-overloaded rats. To test the specificity of the anti-phospho-ERK1/2 antibody, renal cortex lysates were immunoprecipitated with an anti-total ERK antibody and immunoblotted with an anti-tyrosine antibody. This autoradiography is representative of two immunoprecipitation experiments.

References

    1. Remuzzi G, Ruggenenti P, Benigni A. Understanding the nature of renal disease progression. Kidney Int. 1997;51:2–15. - PubMed
    1. Ortiz A, Lorz C, Catalán MP, Justo P, Egido J. Role and regulation of apoptotic cell death in the kidney. Y2K update. Front Biosci. 2000;5:D735–D749. - PubMed
    1. Ortiz A, Lorz C, Justo P, Catalán MP, Egido J. Contribution of apoptotic cell death to renal injury. J Cell Mol Med. 2001;5:18–32. - PMC - PubMed
    1. Thomas ME, Brunskill NJ, Harris KPG, Bailey E, Pringle JH, Furness PN, Walls J. Proteinuria induces tubular cell turnover: a potential mechanism for tubular atrophy. Kidney Int. 1999;55:890–898. - PubMed
    1. Cory S, Adams JM. The Bcl2 family: regulators of the cellular life-or-death switch. Nat Rev Cancer. 2002;2:647–656. - PubMed

Publication types

MeSH terms