. 2004 May;86(5):2674-90.
doi: 10.1016/S0006-3495(04)74323-4.

The facilitated probability of quantal secretion within an array of calcium channels of an active zone at the amphibian neuromuscular junction

Affiliations

The facilitated probability of quantal secretion within an array of calcium channels of an active zone at the amphibian neuromuscular junction

M R Bennett et al. Biophys J. 2004 May.

Abstract

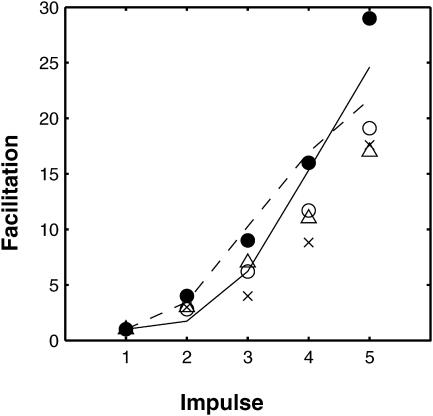
A Monte Carlo analysis has been made of the phenomenon of facilitation, whereby a conditioning impulse leaves nerve terminals in a state of heightened release of quanta by a subsequent test impulse, this state persisting for periods of hundreds of milliseconds. It is shown that a quantitative account of facilitation at the amphibian neuromuscular junction can be given if the exocytosis is triggered by the combined action of a low-affinity calcium-binding molecule at the site of exocytosis and a high-affinity calcium-binding molecule some distance away. The kinetic properties and spatial distribution of these molecules at the amphibian neuromuscular junction are arrived at by considering the appropriate values that the relevant parameters must take to successfully account for the experimentally observed amplitude and time course of decline of F1 and F2 facilitation after a conditioning impulse, as well as the growth of facilitation during short trains of impulses. This model of facilitation correctly predicts the effects on facilitation of exogenous buffers such as BAPTA during short trains of impulses. In addition, it accounts for the relative invariance of the kinetics of quantal release due to test-conditioning sequences of impulses as well as due to change in the extent of calcium influx during an impulse.


Figures

FIGURE 1
FIGURE 1
Geometry for the Monte Carlo simulation. (A) The simulation takes place in a cubic box with a side length of 1 μm. The presynaptic membrane is represented by the base where vesicles, represented by circles, are placed in an array consisting of two parallel lines in the central area; the low-affinity calcium sensor molecule is taken to be at the position of the vesicle. Calcium pumps are placed on all six walls. (B) Shows the placement of vesicles (○) and calcium channels (•) on the presynaptic membrane. The 80 vesicles are in two lines 80 nm apart; the 80 calcium channels are also in two parallel lines 30 nm apart, thus giving a minimum channel-vesicle separation of 25 nm (see dotted box). (C) A cross section of the terminal perpendicular to the presynaptic membrane, showing the placement of a high-affinity calcium sensor molecule (×) at a distance of 100 nm directly above each vesicle (○). (D) Shows the single-channel current and mean open times for a Ca2+ channel. The time course of the Hodgkin-Huxley impulse for a temperature of 6.3°C (dot-dashed line; right scale in mV) is subdivided into nine intervals each of length 0.5 ms. In each subinterval the dashed line gives the single-channel current (left scale in pA) and the solid line gives the probability that a given channel is open (left scale). The single-channel current is based on Delcour et al. (1993) and has been adjusted to allow for the fact that a channel may not be open for all of a subinterval. (See Table 1 in Bennett et al. (2000b) and the discussion surrounding it.)
FIGURE 2
FIGURE 2
The exocytosis due to a conditioning impulse followed by a test impulse 10 ms later, according to the MC model exocytosis molecular scheme. (A) The impulses (Hodgkin-Huxley action potentials) with the conditioning impulse occurring at t = 0 and the test impulse at t = 10 ms; the ordinate shows potential in mV. (B) The extent and timing of exocytosis that occurs as a result of these two impulses, with the ordinate now showing the cumulative number of exocytotic events; results are the average of 1500 simulations.
FIGURE 3
FIGURE 3
The distribution of calcium in the whole terminal, as a function of time, due to a conditioning impulse followed by a test impulse 10 ms later (Fig. 2 A), according to the MC model exocytosis molecular scheme; each graph is the result of a single simulation. (A) The number of free calcium ions. (B) The number of calcium ions bound to the mobile buffer. (C) The number of calcium ions bound to the fixed buffer. (D) The number of calcium ions bound to the pumps in the terminal walls. (E) The number of calcium ions pumped out through the terminal walls. (F) The number of calcium ions bound to the low-affinity molecules for vesicles that have not yet undergone exocytosis.
FIGURE 4
FIGURE 4
As for Fig. 3, except that the volume considered is now the submembraneous region surrounding the active zone; that is, a box of dimensions 1-μm long, 120-nm wide, and 30-nm high sitting on the presynaptic membrane and surrounding the active zone. Panels D and E now refer to pumps in the presynaptic membrane only.
FIGURE 5
FIGURE 5
As for Fig. 3, except that the volume considered is now a box of dimensions 60 nm × 60 nm × 30 nm high surrounding a single vesicle. (The vesicle chosen is one of the four closest to the center of the presynaptic membrane.) Panels D and E now refer to pumps in the presynaptic membrane only. Panel F shows that one calcium ion is bound to the low-affinity molecule for a period of ∼5 ms during which time a second binds instantaneously.
FIGURE 6
FIGURE 6
The extent and timing of exocytosis that occurs as a result of a conditioning impulse followed by a test impulse 10 ms later (see Fig. 2 A), according to the MC model exocytosis molecular scheme. (A) Shows the cumulative release averaged over 1500 runs. (B) Gives the histograms of the corresponding delays in quantal release. For the first pulse there are 112 exocytotic events, with mean delay 2.464 ms and mean ± SD 0.763 ms; for the second pulse the corresponding values are 193 events, 2.585 ms, and 0.896 ms. Panels C and D repeat panels A and B for the case where the calcium influx is reduced by one-half and the number of runs is increased to 10,500. For the first pulse there are 62 events, the mean delay is 2.776 ms and the mean ± SD is 0.803 ms; for the second pulse the corresponding values are 68 events, 2.846 ms, and 0.918 ms. In both cases, a two-tailed t-test indicated no significant difference between the distributions for the first and second pulses.
FIGURE 7
FIGURE 7
The exocytosis due to a train of seven impulses at a frequency of 50 Hz in the absence or presence of an endogenous buffer with the properties of BAPTA, according to the MC model and the facilitation molecular scheme. (A) The 50-Hz train of impulses (Hodgkin-Huxley action potentials); the ordinate shows potential in mV. (B) The extent and timing of exocytosis that occurs as a result of this train of impulses, with the ordinate showing the cumulative number of exocytotic events, averaged over 1500 runs. Results are shown for three concentrations of BAPTA: 0 μM (solid line), 65 μM (dotted line), and 196 μM (dashed line).
FIGURE 8
FIGURE 8
The distribution of calcium in the whole terminal, as a function of time, during a train of seven impulses at a frequency of 50 Hz (Fig. 7 A) in the absence or presence of an endogenous buffer with the properties of BAPTA, according to the MC model and the facilitation molecular scheme; the ordinate gives the number of ions or molecules involved (cf. Fig. 3). (A) The number of free calcium ions. (B) The number of calcium ions bound to the mobile buffer. (C) The number of calcium ions bound to the fixed buffer. (D) The number of calcium ions bound to the pumps in the terminal walls. (E) The number of calcium ions pumped out through the terminal walls. (F) The number of calcium ions bound to the low-affinity sites for vesicles that have not yet undergone exocytosis. (G) The number of calcium ions bound to molecules in the high-affinity sites. (H) The number of calcium ions bound to BAPTA. Results are shown for three concentrations of BAPTA: 0 μM, 65 μM, and 196 μM; in panels A and B, the upper curve is for 0 μM, the middle curve for 65 μM, and the lower curve for 196 μM; in panels CH, the solid line is for 0 μM, the dotted line for 65 μM, and the dashed line for 196 μM. For clarity, some of the data have been time averaged.
FIGURE 9
FIGURE 9
As for Fig. 8, except that the volume considered is now the submembraneous region surrounding the active zone; that is, a box of dimensions 1-μm long, 120-nm wide, and 30-nm high sitting on the presynaptic membrane and surrounding the active zone. Panels D and E now refer to pumps in the presynaptic membrane only.
FIGURE 10
FIGURE 10
As for Fig. 8, except that the volume considered is now a box of dimensions 1-μm long, 120-nm wide, and 30-nm high situated 85 nm above the presynaptic membrane and hence surrounding all the high-affinity sites. Because the box includes pumps only on its ends and does not include the low calcium-affinity site, panels corresponding to D and E in Fig. 8 have been omitted.
FIGURE 11
FIGURE 11
Effect of parameter variation on facilitation. Shown is the facilitation occurring during a train of seven impulses at 50 Hz, normalized to 1 for the first impulse. Calculations are performed using the deterministic version of the facilitation molecular scheme and all parameters, except the one being varied, are given the values in Table 1. (A) Shows the effect of changing the fixed buffer concentration, the values used being (from lowest curve to highest) 310, 1500, 4000, 6000, 7000, and 8000 μM, respectively. (B) Shows the effect of changing the mobile buffer concentration. The solid lines, from lowest curve to highest, are for mobile buffer concentrations of 500, 300, and 100 μM, respectively, the fixed buffer concentration being 8000 μM in each case; the dashed lines show the effect of changing the fixed buffer so that the total buffer concentration is 8100 μM, the lower dashed line being for a mobile buffer concentration of 500 μM and the upper for a concentration of 300 μM. (C) Shows the effect of doubling the pumping rate (dashed line). (D) Shows the effect of changing the binding parameters for the high-affinity molecule: solid line, values as in Table 1; dashed line, qon × 3; dot-dashed line, qoff × 3; dotted line, qon × 3 and qoff × 3.
FIGURE 12
FIGURE 12
Comparison between the calculated facilitation Pn/P1 resulting from each impulse in a train and experimental observations. The facilitation molecular scheme was used with parameter values as given in Table 1. The solid lines give the average results of 1500 MC simulations at (A) 100 Hz and (B) 50 Hz. Experimental results are given by the solid circles, from Fig. 7 in Bennett and Fisher (1977). Shown also are the corresponding calculations using the deterministic version of the facilitation molecular scheme. In this case, three different fixed buffer concentrations were used: 5000 μM (dashed line), 4000 μM (dot-dashed line), and 3500 μM (dotted line).
FIGURE 13
FIGURE 13
Comparison between the facilitation of quantal release as a function of the time interval between the conditioning and test impulses. In A the deterministic version of the exocytosis molecular scheme is used and the line is calculated as P2/P1 where P1 is the number of releases resulting from the conditioning pulse and P2 is the number of releases resulting from the test pulse. Shown are the results for three fixed buffer concentrations: 3500 μM (solid line), 4000 μM (dot-dashed line), and 5000 μM (dotted line). The fit of a double exponential to the solid line gives time constants of decay of 32 ms and 286 ms. Panel B repeats panel A, but now using the facilitation molecular scheme. Here, the fit of a double exponential to the solid line gives time constants of decay of 35 ms and 330 ms and the dashed line is the function f(t) + 1 where f(t) = 0.8e−t/50 + 0.12e−t/300 + 0.025e−t/3000, this being the curve of best fit to the experimental observation as given by Magleby (1973). Panel C shows again the deterministic result of B, together with points each giving the results of 1500 MC runs, with * being for P2/P1 and ○ for formula image where formula image is the mean value of P1 over all the runs (the * points have been displaced slightly to allow the standard deviation error bars to be distinguished); for the longer times the stochastic variation in the MC values make results unreliable so the deterministic solution is to be preferred. Parameter values used are given in Table 1.
FIGURE 14
FIGURE 14
The extent and timing of exocytosis that occurs as a result of a conditioning impulse followed by a test impulse 10 ms later according to the facilitation molecular scheme and the MC model (cf. Fig. 6). (A) Shows the cumulative release averaged over 1500 MC runs. (B) Gives the histograms of the corresponding delays in quantal release. For the first pulse there are 142 exocytotic events, with mean delay 3.146 ms and mean ± SD 1.029 ms; for the second pulse the corresponding values are 338 events, 3.053 ms, and 1.349 ms. Panels C and D repeat A and B for the case where the calcium influx is reduced by one-half and the number of runs increased to 10,500. For the first impulse there are 42 events, the mean delay is 3.424 ms and the mean ± SD is 1.193 ms; for the second impulse the corresponding values are 125 events, 3.383 ms, and 1.280 ms. In both cases, a two-tailed t-test indicated no significant difference between the distributions for the first and second pulses.
FIGURE 15
FIGURE 15
The frequency of secretion of quanta at different intervals after several impulses in a train of seven impulses at 50 Hz according to the MC model and the facilitatory molecular scheme. Panels A, B, and C are histograms of the number of releases in 50 runs, after the first, fourth, and seventh impulses, respectively; the bin width is 0.5 ms. (D) Shows the average cumulative quantal release after the second (P2, solid line), fourth (P4, dotted line), and seventh (P7, dashed line) impulse, all normalized to unity. Note that the time to peak is slightly longer for the later pulses (compare P4 and P7 with P1).
FIGURE 16
FIGURE 16
Effects of different concentrations of BAPTA on the cumulative quantal release Pn by each action potential during a train of seven impulses at 50 Hz, according to the facilitatory molecular scheme. (A) Gives the release (peak R in Eq. 6) for each impulse in the following concentrations of BAPTA: continuous line, 0 μM; dashed line, 30 μM; dot-dashed line, 70 μM; dotted line, 100 μM; asterisk line, 200 μM. (B) Gives the extent of facilitation, Pn/P1, for the same concentrations of BAPTA. Panels A and B are produced using the deterministic model; panels C and D repeat the calculations using the MC model, the results shown being the average of 1500 runs; note that C now gives the average number of quantal releases. Because of the stochastic variability in the release due to the first pulse (compare C with A), rather than dividing by the amplitude of the first pulse in D the curves have been normalized by dividing by an average ratio of C/A. Specifically, if bi is the amplitude of the ith pulse in B and ci is the amplitude of the ith pulse in C, then define α = meani(ci/bi) and use ci/α instead of ci/c1 to calculate D; this is done independently for each BAPTA level.
FIGURE 17
FIGURE 17
Comparison between the predicted and experimental effects of BAPTA on the decay time course of facilitation. (A) Gives the control. (B) After the application of BAPTA (100 μM). Open circles are experimental results from Tanabe and Kijima (1992; see their Fig. 3), reduced by 0.5 to allow for augmentation and potentiation, and the continuous line the theoretical values calculated using the deterministic version of the facilitation molecular scheme. Theoretical values are not given for very short times as it is only for 100 ms and longer that accurate experimental values are available. The stimulation protocol for the theoretical curves was 10 pulses at 100 Hz, as this gave the best agreement with the experimental results during the rising phase (not shown). A double exponential fit to the solid line in panel A gives time constants of decay of 37 ms and 308 ms, with corresponding amplitudes of 2.89 and 1.52; for panel B the corresponding values are 50 ms and 433 ms, with amplitudes of 0.3 and 2.36. Experimentally, Tanabe and Kijima (1992) give F2 time constants of 325 ms for the control and 451 ms in the presence of BAPTA.
FIGURE 18
FIGURE 18
Facilitation at the crayfish neuromuscular junction, according to the model of Matveev et al. (2002). Theoretical results are shown for a stimulation train of five impulses at 100 Hz (solid line) and at 50 Hz (dashed line). Also shown is experimental data for the 100-Hz case: •, Tang et al. (2000), Fig. 1 C (Control); ○, Tang et al. (2000), Fig. 2 C (Control); ▵, Winslow et al. (1994), Fig. 2 C (Control); and for the 50-Hz case: ×, Zucker (1974), Table 3 (top line).

Similar articles

Cited by

References

    1. Atluri, P. P., and W. G. Regehr. 1996. Determinants of the time course of facilitation at the granule cell to Purkinje cell synapse. J. Neurosci. 16:5661–5671. - PMC - PubMed
    1. Bain, A. I., and D. M. Quastel. 1992. Multiplicative and additive Ca(2+)-dependent components of facilitation at mouse endplates. J. Physiol. 455:383–405. - PMC - PubMed
    1. Bartol, T. M. Jr., B. R. Land, E. E. Salpeter, and M. M. Salpeter. 1991. Monte Carlo simulation of miniature endplate current generation in the vertebrate neuromuscular junction. Biophys. J. 59:1290–1307. - PMC - PubMed
    1. Bennett, M. R., and C. Fisher. 1977. The effects of calcium on the binomial parameters that control acetylcholine release during trains of nerve impulses at amphibian neuromuscular synapses. J. Physiol. 271:673–698. - PMC - PubMed
    1. Bennett, M. R., W. G. Gibson, and J. Robinson. 1997. Probabilistic secretion of quanta and the synaptosecretosome hypothesis: evoked release at active zones of varicosities, boutons and endplates. Biophys. J. 73:1815–1829. - PMC - PubMed

Publication types

LinkOut - more resources