. 2004 May;86(5):2910-22.
doi: 10.1016/S0006-3495(04)74342-8.

Liquid domains in vesicles investigated by NMR and fluorescence microscopy

Affiliations

Liquid domains in vesicles investigated by NMR and fluorescence microscopy

S L Veatch et al. Biophys J. 2004 May.

Abstract

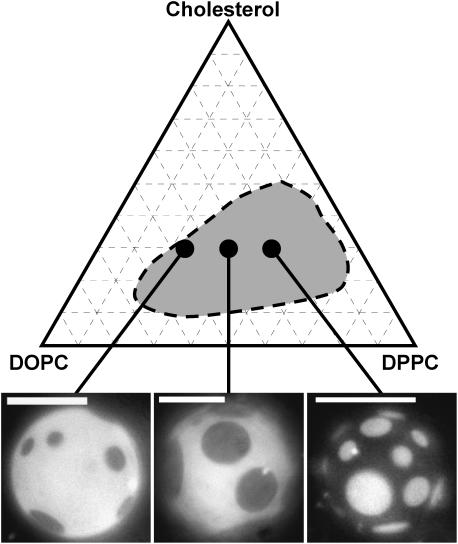
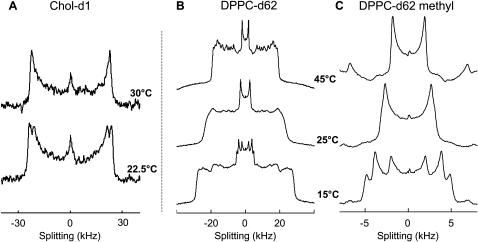
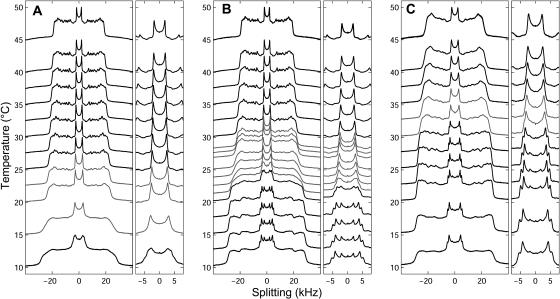
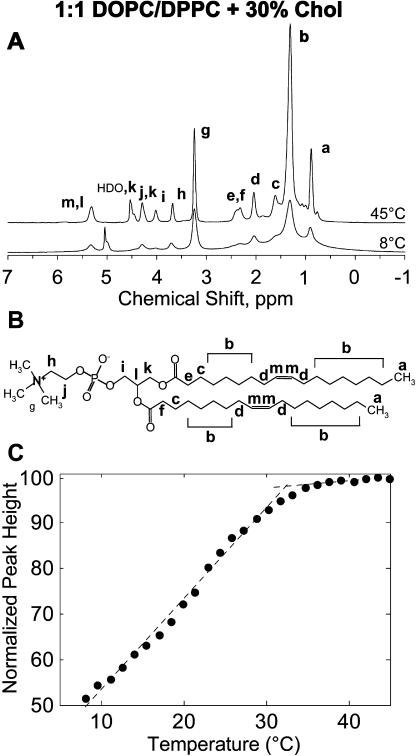
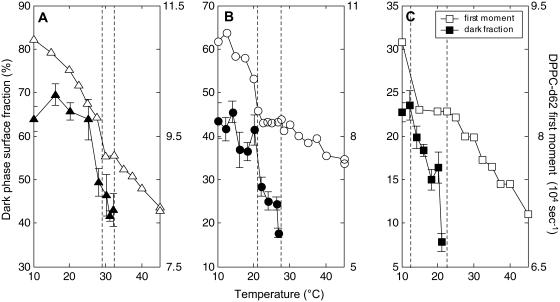
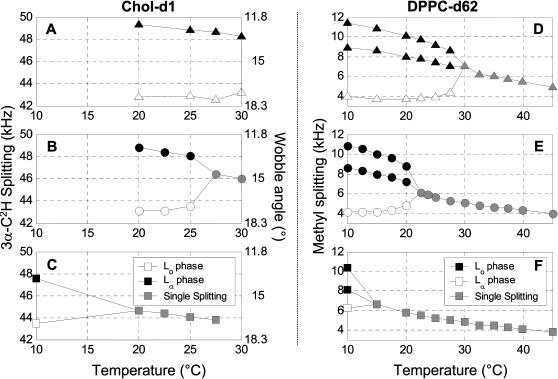
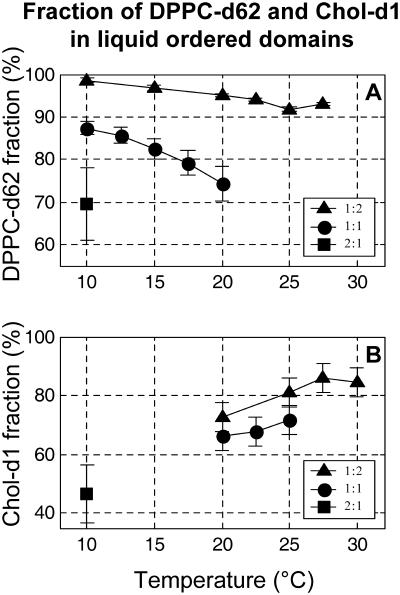
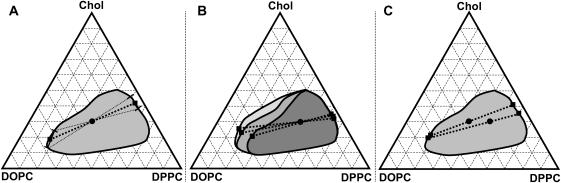
We use (2)H-NMR, (1)H-MAS NMR, and fluorescence microscopy to detect immiscibility in three particular phospholipid ratios mixed with 30% cholesterol: 2:1 DOPC/DPPC, 1:1 DOPC/DPPC, and 1:2 DOPC/DPPC. Large-scale (>>160 nm) phase separation into liquid-ordered (L(o)) and liquid-crystalline (L(alpha)) phases is observed by both NMR and fluorescence microscopy. By fitting superimposed (2)H-NMR spectra, we quantitatively determine that the L(o) phase is strongly enriched in DPPC and moderately enriched in cholesterol. Tie-lines estimated at different temperatures and membrane compositions are based on both (2)H-NMR observations and a previously published ternary phase diagram. (2)H- and (1)H-MAS NMR techniques probe significantly smaller length scales than microscopy experiments (submicron versus micron-scalp), and complex behavior is observed near the miscibility transition. Fluorescence microscopy of giant unilamellar vesicles shows micrometer-scale domains below the miscibility transition. In contrast, NMR of multilamellar vesicles gives evidence for smaller ( approximately 80 nm) domains just below the miscibility transition, whereas large-scale demixing occurs at a lower temperature, T(low). A transition at T(low) is also evident in fluorescence microscopy measurements of the surface area fraction of ordered phase in giant unilamellar vesicles. Our results reemphasize the complex phase behavior of cholesterol-containing membranes and provide a framework for interpreting (2)H-NMR experiments in similar membranes.


Figures

FIGURE 1
FIGURE 1
(Top) Sketch of miscibility phase boundary for ternary membranes of DOPC, DPPC, and cholesterol at 25°C (Veatch and Keller, 2003b). (Bottom) Fluorescence micrographs of GUVs with membrane composition studied by NMR. Vesicles are imaged at 25°C and compositions are 30% cholesterol mixed with (from left to right) 2:1 DOPC/DPPC, 1:1 DOPC/DPPC, and 1:2 DOPC/DPPC. Scale bars are 20 μm.
FIGURE 2
FIGURE 2
Selected 2H-NMR spectra for MLVs of (A) 1:1 DOPC/DPPC + 30% Chol-d1 and (B,C) 1:1 DOPC/DPPC-d62 + 30% Chol. Spectra in C are an expanded view of the terminal methyl splitting in B. At low temperature (22.5°C in A and 15°C in B,C), multiple splittings are present in both Chol-d1 and in the methyl region of DPPC-d62 indicating that large-scale (≫160 nm) phase separation has occurred.
FIGURE 3
FIGURE 3
Temperature stack of 2H-NMR spectra from MLVs of (A) 2:1 DOPC/DPPC-d62 + 30% Chol, (B) 1:1 DOPC/DPPC-d62 + 30% Chol, and (C) 1:2 DOPC/DPPC-d62 + 30% Chol. Spectra in shaded gray show reduced resolution and are obtained between Tmix and Tlow.
FIGURE 4
FIGURE 4
First moment of DPPC-d62 spectra in ▪□ 1:2 DOPC/DPPC-d62 + 30% Chol, •○ 1:1 DOPC/DPPC-d62 + 30% Chol, and ▴▵ 2:1 DOPC/DPPC-d62 + 30% Chol membranes. Open symbols depict the plateau region between Tlow and Tmix. •○ points were obtained by both decreasing and increasing temperature.
FIGURE 5
FIGURE 5
(A) Proton magic angle spinning NMR spectra of multilamellar vesicles of 1:1 DOPC:DPPC + 30% cholesterol. The top spectrum was acquired at 45°C and the bottom at 8°C. (B) Assignment of major lipid resonances is illustrated using molecular structure of DOPC. DPPC has essentially the same spectrum but lacks signals related to the double bond (d, m) and has a different number of saturated methylenes (b). (C) Peak height of the methylene proton resonance at 1.3 ppm normalized to the signal at 45°C. Lower peak heights at lower temperatures indicate a larger fraction of ordered component. The onset of demixing at Tmix agrees with fluorescent microscopy results. Error bars are smaller than data points, suggesting that the small change in slope near 20°C may be evidence of a transition at Tlow.
FIGURE 6
FIGURE 6
First moment of DPPC-d62 spectra (open symbols) and surface fraction of dark phase from fluorescence micrographs (solid symbols) for membranes of ▪□ 1:2 DOPC/DPPC-d62+30% Chol, •○ 1:1 DOPC/DPPC-d62+30% Chol, and ▴▵ 2:1 DOPC/DPPC-d62 + 30% Chol.
FIGURE 7
FIGURE 7
(AC) Magnitude of 3α C-2H splitting in Chol-d1 spectra (left axis) and associated wobble angle (right axis) in membranes of (A) 1:2 DOPC/DPPC + 30% Chol-d1, (B) 1:1 DOPC/DPPC + 30% Chol-d1, and (C) 2:1 DOPC/DPPC + 30% Chol-d1. White (black) symbols label the Lα (Lo) phase when multiple peaks are present. (DF) Magnitude of DPPC-d62 terminal methyl splitting in membranes of (D) 1:2 DOPC/DPPC-d62 + 30% Chol, (E) 1:1 DOPC/DPPC-d62 + 30% Chol, and (F) 2:1 DOPC/DPPC-d62 + 30% Chol. Again, white (black) symbols label the Lα (Lo) phase when multiple peaks are present. Two sets of Lo phase splittings are present at low temperature and are due to nonequivalence of the sn-1 and sn-2 methyl peaks in that phase (see text).
FIGURE 8
FIGURE 8
Fraction of (A) DPPC-d62 and (B) Chol-d1 in liquid-ordered domains (as opposed to Lα domains). Membranes are composed of 30% Chol (or Chol-d1) with either ▪ 1:2 DOPC/DPPC (or DPPC-d62), • 1:1 DOPC/DPPC (or DPPC-d62), or ▴ 2:1 DOPC/DPPC (or DPPC-d62).
FIGURE 9
FIGURE 9
Estimated tie-lines in DOPC/DPPC/cholesterol ternary phase diagram. (A) The tie-line for the mixture of 1:1 DOPC/DPPC + 30% cholesterol at 25°C is denoted by a thick dashed line. Thin dashed lines are bounds on the errors and are representative of all calculated tie-lines. (B) Phase boundary and tie-lines for 1:2 DOPC/DPPC + 30% cholesterol membranes at 30°C (dark shaded), 25°C (medium shaded), and 20°C (light shaded). (C) Tie-lines through the points 1:1 and 1:2 DOPC/DPPC + 30% cholesterol at 25°C.

References

    1. Alecio, M. R., D. E. Golan, W. R. Veatch, and R. R. Rando. 1982. Use of a fluorescent cholesterol derivative to measure lateral mobility of cholesterol in membranes. Proc. Natl. Acad. Sci. USA. 79:5171–5174. - PMC - PubMed
    1. Anderson, R. G., and K. Jacobson. 2002. A role for lipid shells in targeting proteins to caveolae, rafts, and other lipid domains. Science. 296:1821–1825. - PubMed
    1. Angelova, M. I., S. Soleau, P. Meleard, J. F. Faucon, and P. Bothorel. 1992. Preparation of giant vesicles by external AC electric fields. Kinetics and applications. Progr. Colloid Polym. Sci. 89:127–131.
    1. Aussenac, F., M. Tavares, and E. J. Dufourc. 2003. Cholesterol dynamics in membranes of raft composition: a molecular point of view from 2H and 31P solid-state NMR. Biochemistry. 42:1383–1390. - PubMed
    1. Baumgart, T., S. T. Hess, and W. W. Webb. 2003. Imaging coexisting fluid domains in biomembrane models coupling curvature and line tension. Nature. 425:821–824. - PubMed

Publication types

LinkOut - more resources