. 2004 May;86(5):2965-79.
doi: 10.1016/S0006-3495(04)74347-7.

Role of cholesterol in the formation and nature of lipid rafts in planar and spherical model membranes

Affiliations

Role of cholesterol in the formation and nature of lipid rafts in planar and spherical model membranes

Jonathan M Crane et al. Biophys J. 2004 May.

Abstract

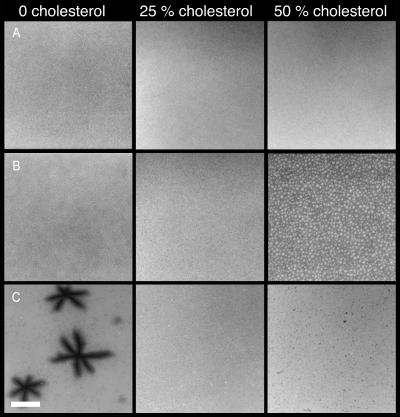
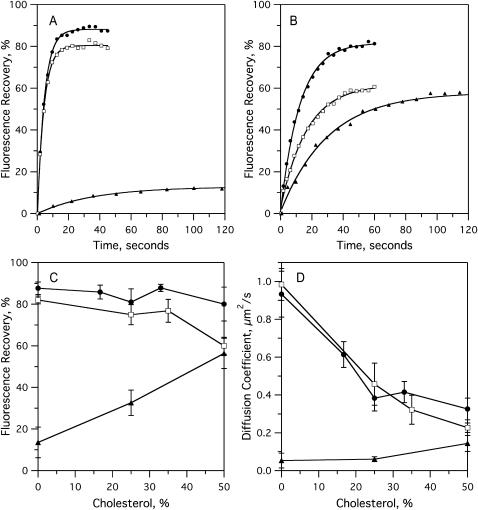
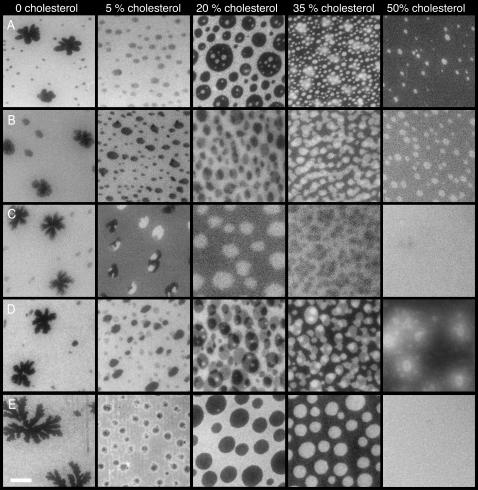
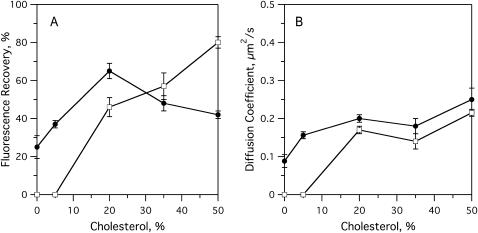
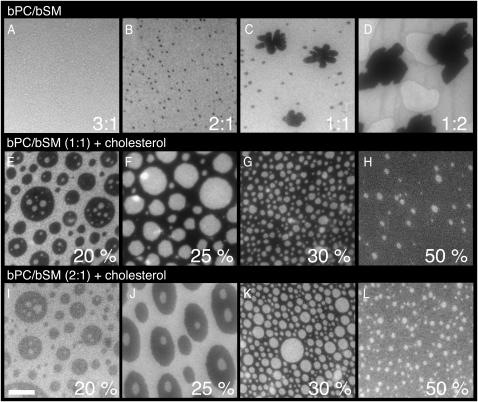
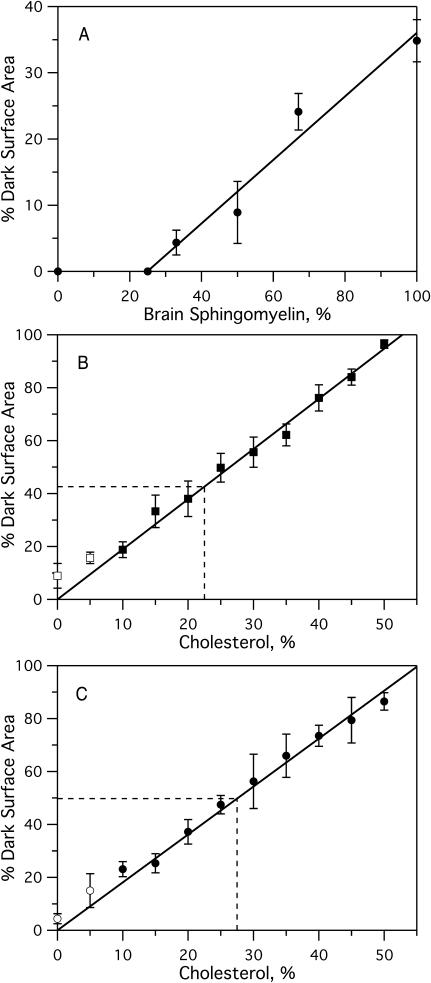
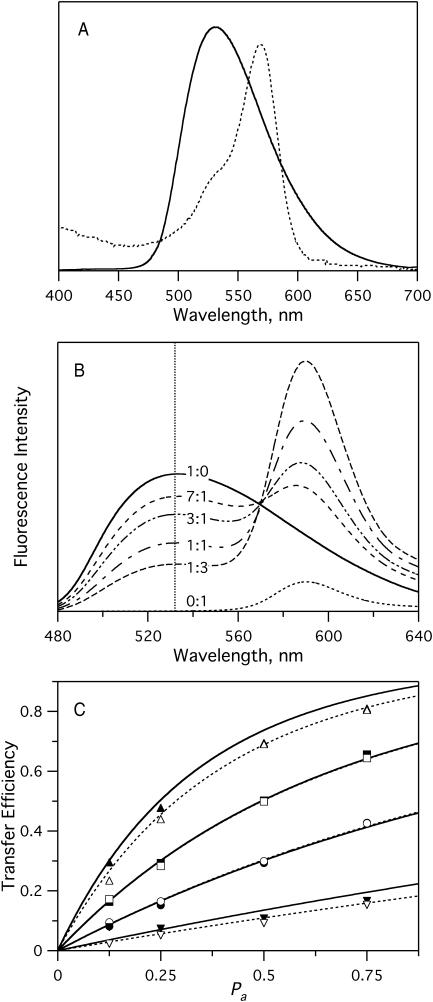
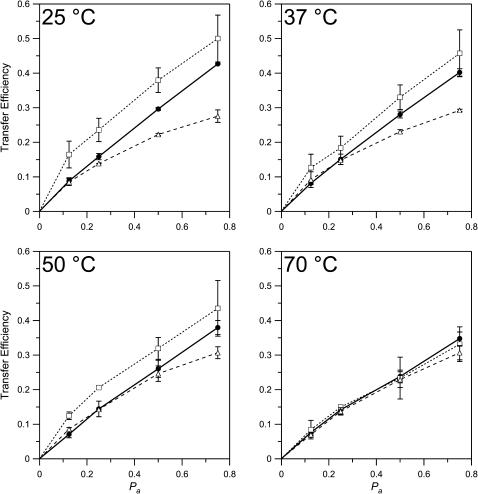
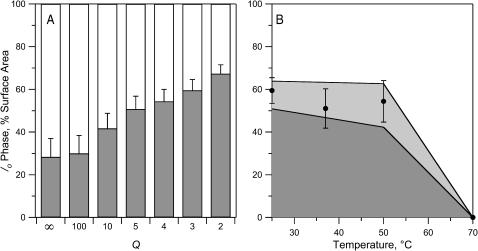
Sterols play a crucial regulatory and structural role in the lateral organization of eukaryotic cell membranes. Cholesterol has been connected to the possible formation of ordered lipid domains (rafts) in mammalian cell membranes. Lipid rafts are composed of lipids in the liquid-ordered (l(o)) phase and are surrounded with lipids in the liquid-disordered (l(d)) phase. Cholesterol and sphingomyelin are thought to be the principal components of lipid rafts in cell and model membranes. We have used fluorescence microscopy and fluorescence recovery after photobleaching in planar supported lipid bilayers composed of porcine brain phosphatidylcholine (bPC), porcine brain sphingomyelin (bSM), and cholesterol to map the composition-dependence of l(d)/l(o) phase coexistence. Cholesterol decreases the fluidity of bPC bilayers, but disrupts the highly ordered gel phase of bSM, leading to a more fluid membrane. When mixed with bPC/bSM (1:1) or bPC/bSM (2:1), cholesterol induces the formation of l(o) phase domains. The fraction of the membrane in the l(o) phase was found to be directly proportional to the cholesterol concentration in both phospholipid mixtures, which implies that a significant fraction of bPC cosegregates into l(o) phase domains. Images reveal a percolation threshold, i.e., the point where rafts become connected and fluid domains disconnected, when 45-50% of the total membrane is converted to the l(o) phase. This happens between 20 and 25 mol % cholesterol in 1:1 bPC/bSM bilayers and between 25 and 30 mol % cholesterol in 2:1 bPC/bSM bilayers at room temperature, and at approximately 35 mol % cholesterol in 1:1 bPC/bSM bilayers at 37 degrees C. Area fractions of l(o) phase lipids obtained in multilamellar liposomes by a fluorescence resonance energy transfer method confirm and support the results obtained in planar lipid bilayers.


Figures

FIGURE 1
FIGURE 1
Fluorescence micrographs of bilayers of binary mixtures containing (A) POPC, (B) bPC, or (C) bSM, and cholesterol. Bilayers were formed by the Langmuir-Blodgett/Schäfer method on quartz slides. POPC and bPC bilayers were stained with 0.5% Rh-DOPE in the monolayer applied distally to the quartz support. The bSM bilayers were stained with 0.5% Rh-DPPE in the monolayer applied distally to the quartz support. Experiments were performed at room temperature. The white bar represents 20 μm.
FIGURE 2
FIGURE 2
Fluorescence recovery after photobleaching (FRAP) experiments on bilayers of binary mixtures containing POPC, bPC, or bSM, and cholesterol. Bilayers were formed by the Langmuir-Blodgett/Schäfer method on quartz slides. Each bilayer was stained with 1% NBD-DOPE (NBD-DPPE in cases with bSM) in the monolayer applied distally to the quartz support. Experiments were performed at room temperature. (A) Examples of recovery curves in POPC (•), bPC (□), and bSM (▴) bilayers with no cholesterol. (B) Examples of recovery curves in POPC (•), bPC (□), and bSM (▴) bilayers with 50% cholesterol. (C) Fast fluorescence recovery fractions in POPC (•), bPC (□), and bSM (▴) bilayers as a function of cholesterol concentration. (D) Diffusion coefficients in POPC (•), bPC (□), and bSM (▴) bilayers as a function of cholesterol concentration. Each point in C and D is the mean ± SD of 12 curves obtained from at least three individually prepared bilayers.
FIGURE 3
FIGURE 3
Fluorescence micrographs of bPC/bSM (1:1) bilayers with increasing cholesterol concentrations, and stained with various fluorescently labeled lipids. Bilayers were formed by the Langmuir-Blodgett/Schäfer method on quartz slides. Each bilayer was stained with the following dyes in the monolayer applied distally to the quartz support: (A) 0.5% Rh-DOPE, (B) 1% NBD-DOPE, (C) 1% NBD-DPPE, (D) 0.5% DiIC12, and (E) 0.5% DiIC18. Experiments were performed at room temperature. The white bar represents 10 μm.
FIGURE 4
FIGURE 4
FRAP experiments on raft-containing planar bilayers with dyes that partition favorably into opposite phases. Bilayers were formed by the Langmuir-Blodgett/Schäfer method on quartz slides. Each bilayer was stained in the monolayer applied distally to the quartz support. Experiments were performed at room temperature. (A) Fast fluorescence recovery fractions in bPC/bSM (1:1) bilayers as a function of cholesterol concentration and stained with (•) 1% NBD-DOPE or (□) 1% NBD-DPPE. (B) Diffusion coefficients in bPC/bSM (1:1) bilayers as a function of cholesterol concentration and stained with (•) 1% NBD-DOPE or (□) 1% NBD-DPPE.
FIGURE 5
FIGURE 5
Fluorescence micrographs of bilayers at different bPC/bSM ratios and with different cholesterol concentrations. (Top row) bPC/bSM bilayers in ratios of A, 3:1; B, 2:1; C, 1:1; and D, 1:2, in the absence of cholesterol. (Middle row) bPC/bSM (1:1) with E, 20%; F, 25%; G, 30%; and H, 50% cholesterol. (Bottom row) bPC/bSM (2:1) with I, 20%; J, 25%; K, 30%; and L, 50% cholesterol. Bilayers were formed by the Langmuir-Blodgett/Schäfer method on quartz slides. Each bilayer was stained with 0.5% Rh-DOPE in the monolayer applied distally to the quartz support. Experiments were performed at room temperature. The white bar represents 10 μm.
FIGURE 6
FIGURE 6
Percent dark surface area as a function of bPC, bSM, or cholesterol as determined by analyzing the fluorescence images of planar lipid bilayers formed by the Langmuir-Blodgett/Schäfer method on quartz slides. Each bilayer was stained with 0.5% Rh-DOPE in the monolayer applied distally to the quartz support. Experiments were performed at room temperature. (A) Percent dark area as a function of percent bSM in binary bPC/bSM mixtures (from Fig. 5, AD). The line represents the least-squares fit of the data above 25% SM. (B and C) Percent dark area versus cholesterol content (B) 1:1 bPC/bSM (from Fig. 5, EH) and (C) 2:1 bPC/bSM (from Fig. 5, IL). Solid lines represent a least-squares fit through the origin. Points representing 0 and 5% cholesterol were excluded from the fit because the dark areas represent gel (0% cholesterol) and a mixture of gel and lo phases (5% cholesterol, see text). Dashed lines represent approximate locations of the percolation threshold.
FIGURE 7
FIGURE 7
FRET between NBD-PE and Rh-DOPE in multilamellar liposomes of pure bPC. (A) Spectral overlap of NBD-DOPE emission (solid) and Rh-DOPE absorbance (dashed). Dye concentration was 1% of the total lipid in both cases. (B) Example of a FRET experiment. Emission spectra with labels indicating the NBD-DOPE/Rh-DOPE ratio. Total dye concentration was 1%. Intensities were normalized to emission at 532 nm in the presence of 50 mM β-OG, where all FRET was relieved. (C) Comparison of experimental results to the model of Wolber and Hudson (1979). The plots show FRET efficiency versus Pa (mole fraction of dyes that are acceptors) in bPC vesicles with (▾,▿) 0.2%, (•,○) 0.5%, (▪,□) 1%, and (▴,▵) 2% dye. (For solid symbols, NBD-DOPE was the donor; for open symbols, NBD-DPPE was the donor.) Rh-DOPE was the acceptor in every case. Solid curves are calculated transfer efficiencies using known dye concentrations and Eq. 7. Dashed curves are least-squares fits of the experimental data to Eq. 7. Excitation was at 466 nm. All experiments were performed at 25°C.
FIGURE 8
FIGURE 8
Comparison of transfer efficiencies in the presence and absence of rafts. • are from bPC bilayers in multilamellar liposomes in the absence of cholesterol and at a dye concentration of 0.5% in bPC, with a donor of NBD-DPPE or NBD-DOPE and an acceptor of Rh-DOPE. □, bPC/bSM (1:1), 35% cholesterol, 0.5% NBD-DOPE/Rh-DOPE. ▵, bPC/bSM (1:1), 35% cholesterol, 0.5% NBD-DPPE/Rh-DOPE.
FIGURE 9
FIGURE 9
Area fractions of lo phase lipid calculated from the data presented in Fig. 8 using Eqs. 8 and 10. (A) Area fraction of lo phase as a function of the ratio Q of DOPE-linked dyes in the ld phase divided by DOPE-linked dyes in the lo phase at 25°C. (B) Area fraction of lo phase as a function of temperature, assuming Q = 3. The lighter shaded area represents the area of uncertainty as delineated by least-squares fits to the extrema of the error bars of the first three data points.

References

    1. Ahmed, S. N., D. A. Brown, and E. London. 1997. On the origin of sphingolipid/cholesterol-rich detergent-insoluble cell membranes: physiological concentrations of cholesterol and sphingolipid induce formation of a detergent-insoluble, liquid-ordered phase in model membranes. Biochemistry. 36:10944–10953. - PubMed
    1. Anderson, R. G. W., and K. Jacobson. 2002. A role for lipid shells in targeting proteins to caveolae, rafts, and other lipid domains. Science. 296:1821–1825. - PubMed
    1. Baird, B., E. D. Sheets, and D. Holowka. 1999. How does the plasma membrane participate in cellular signaling by receptors for immunoglobulin E? Biophys. Chem. 82:109–119. - PubMed
    1. Baumgart, T., T. S. Hess, and W. W. Webb. 2003. Imaging coexisting fluid domains in biomembrane models coupling curvature and line tension. Nature. 425:821–824. - PubMed
    1. Bloch, K. 1991. Cholesterol: evolution of structure and function. In Biochemistry of Lipids, Lipoproteins and Membranes. D. E. Vance and J. E. Vance, editors. Elsevier, Amsterdam, The Netherlands. 363–381.

Publication types

MeSH terms