. 2004 May;86(5):3269-83.
doi: 10.1016/S0006-3495(04)74375-1.

Dynamic elastic modulus of porcine articular cartilage determined at two different levels of tissue organization by indentation-type atomic force microscopy

Affiliations

Dynamic elastic modulus of porcine articular cartilage determined at two different levels of tissue organization by indentation-type atomic force microscopy

Martin Stolz et al. Biophys J. 2004 May.

Abstract

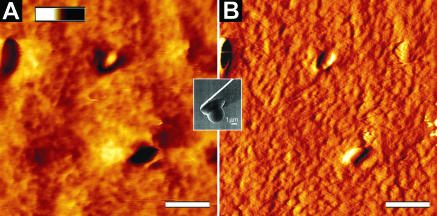
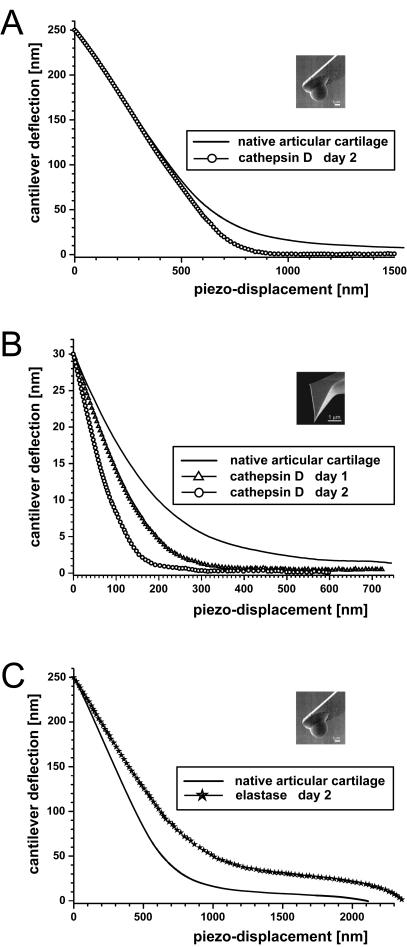
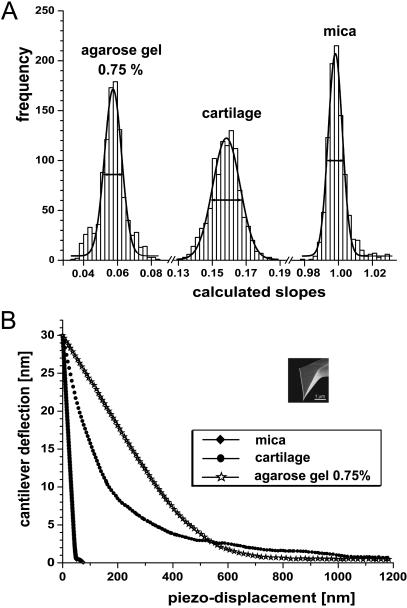
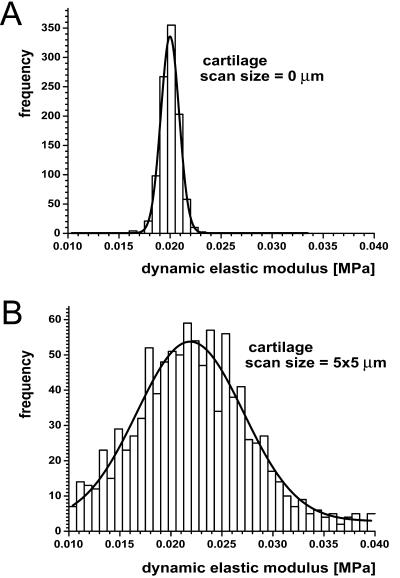
Cartilage stiffness was measured ex vivo at the micrometer and nanometer scales to explore structure-mechanical property relationships at smaller scales than has been done previously. A method was developed to measure the dynamic elastic modulus, |E(*)|, in compression by indentation-type atomic force microscopy (IT AFM). Spherical indenter tips (radius = approximately 2.5 microm) and sharp pyramidal tips (radius = approximately 20 nm) were employed to probe micrometer-scale and nanometer-scale response, respectively. |E(*)| values were obtained at 3 Hz from 1024 unloading response curves recorded at a given location on subsurface cartilage from porcine femoral condyles. With the microsphere tips, the average modulus was approximately 2.6 MPa, in agreement with available millimeter-scale data, whereas with the sharp pyramidal tips, it was typically 100-fold lower. In contrast to cartilage, measurements made on agarose gels, a much more molecularly amorphous biomaterial, resulted in the same average modulus for both indentation tips. From results of AFM imaging of cartilage, the micrometer-scale spherical tips resolved no fine structure except some chondrocytes, whereas the nanometer-scale pyramidal tips resolved individual collagen fibers and their 67-nm axial repeat distance. These results suggest that the spherical AFM tip is large enough to measure the aggregate dynamic elastic modulus of cartilage, whereas the sharp AFM tip depicts the elastic properties of its fine structure. Additional measurements of cartilage stiffness following enzyme action revealed that elastase digestion of the collagen moiety lowered the modulus at the micrometer scale. In contrast, digestion of the proteoglycans moiety by cathepsin D had little effect on |E(*)| at the micrometer scale, but yielded a clear stiffening at the nanometer scale. Thus, cartilage compressive stiffness is different at the nanometer scale compared to the overall structural stiffness measured at the micrometer and larger scales because of the fine nanometer-scale structure, and enzyme-induced structural changes can affect this scale-dependent stiffness differently.


Figures

FIGURE 1
FIGURE 1
Schematic representation of a load-indentation curve during the first complete cycle of loading and unloading. pmax is the maximum applied load, p, at maximal indentation depth, hmax, and S = dh/dp is the slope of the hypotenuse. In IT AFM measurements of cartilage, the slope of the upper 75% of the unloading curve (dashed line) was used for the analysis of the unloading data recorded by employing a sharp pyramidal tip. When employing a micrometer-sized spherical indenter, S was the slope of the upper 25% of the unloading curve (bold line).
FIGURE 2
FIGURE 2
Plots of representative data used to develop a calibration curve for the direct conversion of IT AFM load-displacement curves into modulus values. (A) Stress-strain data for two agarose gels with n = 3 measurements each that are exhibiting the same slope (2.0 lower data sets and 2.5 upper data sets) in compression; (B) modulus values for three agarose gels (2.0%, 2.5%, and 3.0%) measured by compression testing, showing a linear trend with respect to the percent agarose in the gels; (C) the final calibration curve relating the slope of IT AFM load-displacement curves to a corresponding elastic modulus for the three agarose gels (2.0%, 2.5%, and 3.0%). The simplest functional relationship was y(x) = (n/(1–x))−n, where n = 21 is the fitting parameter, as indicated by the solid curve. A gel with a modulus approaching zero will not bend the cantilever, so the calibration curve must go through the origin, and for an “infinitely” hard sample, the slope is 1; thus the asymptotic behavior.
FIGURE 3
FIGURE 3
Load-displacement curves of articular cartilage recorded with (A) a sharp AFM tip with a nominal tip-radius ∼20 nm and (B) a spherical tip glued to an AFM-cantilever (radius = 2.5 μm). Load-displacement curves shown are each based on 1024 measurements taken at a single site.
FIGURE 4
FIGURE 4
Comparison of the structure of (A) an agarose gel (2.5% agarose) with that of (B) articular cartilage as imaged using a sharp AFM tip with a nominal tip radius of ∼20 nm. The images demonstrate what the indentation tip “sees” at the nanometer scale. The agarose gel was imaged under aqueous solution, whereas the articular cartilage was imaged both under buffer solution and after cryo-thin-sectioning in air. Because of the higher resolution the image in air is presented here. The scale bars represent a distance of 1 μm.
FIGURE 5
FIGURE 5
AFM images of native articular cartilage imaged in buffer using the microspherical tip: (A) topographic or height image and (B) deflection image. The height range (bar from white to black in A) is 10 μm and the scale bars represent a distance of 20 μm.
FIGURE 6
FIGURE 6
Load-displacement curves comparing the response of articular cartilage before and after enzymatic digestion with cathepsin D (A and B) and elastase (C). In A and C, measurements were made using the microsphere tip, whereas in B, measurements were made using the sharp pyramidal tip. The same samples (n = 3) were evaluated using both indenter sizes; however, measurements on elastase-digested cartilage using the sharp pyramidal tip were not feasible, due to the tip sticking in the digested cartilage.
FIGURE 7
FIGURE 7
(A) Histograms and corresponding Gaussian distribution curves for repeated stiffness measurements on mica, agarose gel, and articular cartilage. Each histogram was based on 1024 load-displacement curves and was taken at a single site. (B) Averaged unloading load-displacement curves for the three different materials corresponding to the curves within ±1% of the frequency peak in A.
FIGURE 8
FIGURE 8
Histograms and corresponding Gaussian distribution curves for (A) 1024 stiffness measurements at a given site, i.e., at scan size 0, and (B) 1024 stiffness measurements at multiple sites spaced evenly over a 5 × 5 μm area. The data were taken at the nanometer scale on porcine articular cartilage.

References

    1. A-Hassan, E., W. F. Heinz, M. D. Antonik, N. P. D'Costa, S. Nageswaran, C. A. Schoenenberger, and J. H. Hoh. 1998. Relative microelastic mapping of living cells by atomic force microscopy. Biophys. J. 74:1564–1578. - PMC - PubMed
    1. Appleyard, R. C., M. V. Swain, S. Khanna, and G. A. Murrell. 2001. The accuracy and reliability of a novel handheld dynamic indentation probe for analysing articular cartilage. Phys. Med. Biol. 46:541–550. - PubMed
    1. Aspden, R. M., T. Larsson, R. Svensson, and D. Heinegard. 1991. Computer-controlled mechanical testing machine for small samples of biological viscoelastic materials. J. Biomed. Eng. 13:521–525. - PubMed
    1. Bader, D. L., and G. E. Kempson. 1994. The short-term compressive properties of adult human articular cartilage. Biomed. Mater. Eng. 4:245–256. - PubMed
    1. Bueckle, H. 1973. The Science of Hardness Testing and its Research Applications. J.W. Westbrook and H. Conrad, editors. American Society for Metals, Materials Park, Ohio.

Publication types