. 2004 May;123(5):475-89.
doi: 10.1085/jgp.200409052.

Mapping the BKCa channel's "Ca2+ bowl": side-chains essential for Ca2+ sensing

Affiliations

Mapping the BKCa channel's "Ca2+ bowl": side-chains essential for Ca2+ sensing

Lin Bao et al. J Gen Physiol. 2004 May.

Abstract

There is controversy over whether Ca(2+) binds to the BK(Ca) channel's intracellular domain or its integral-membrane domain and over whether or not mutations that reduce the channel's Ca(2+) sensitivity act at the point of Ca(2+) coordination. One region in the intracellular domain that has been implicated in Ca(2+) sensing is the "Ca(2+) bowl". This region contains many acidic residues, and large Ca(2+)-bowl mutations eliminate Ca(2+) sensing through what appears to be one type of high-affinity Ca(2+)-binding site. Here, through site-directed mutagenesis we have mapped the residues in the Ca(2+) bowl that are most important for Ca(2+) sensing. We find acidic residues, D898 and D900, to be essential, and we find them essential as well for Ca(2+) binding to a fusion protein that contains a portion of the BK(Ca) channel's intracellular domain. Thus, much of our data supports the conclusion that Ca(2+) binds to the BK(Ca) channel's intracellular domain, and they define the Ca(2+) bowl's essential Ca(2+)-sensing motif. Overall, however, we have found that the relationship between mutations that disrupt Ca(2+) sensing and those that disrupt Ca(2+) binding is not as strong as we had expected, a result that raises the possibility that, when examined by gel-overlay, the Ca(2+) bowl may be in a nonnative conformation.


Figures

F<sc>igure</sc> 1.
Figure 1.
General topology of the BKCa channel. (A) Diagram of the fourfold-symmetric BKCa channel, composed of four “slo” subunits. (B) Putative topology of a single subunit. Apparent is the integral-membrane domain (based loosely on the recent structure of the KvAP channel; Jiang et al., 2003) and the intracellular domain. In the latter are indicated the RCK domain, whose representation was modeled after the structure of the MthK channel's RCK domain (Jiang et al., 2002), and the Ca2+ bowl, whose structure is unknown. (C) Amino acid sequence of the Ca2+ bowl. Residues with acidic side chains are indicated in red. Other oxygen-containing side chains are indicated in green. Side chains without oxygen are indicated in black.
F<sc>igure</sc> 2.
Figure 2.
mSlo mutations that eliminate high-affinity Ca2+ sensing. Average normalized G-V relations determined at 0.003, 0.8, and 10 μM internal [Ca2+]. Data are from inside-out Xenopus oocyte macropatches expressing cRNA from either (A) wild-type mSlo, (B) the RCK mutant M513I, (C) the Ca2+-bowl deletion mutant Δ896–903, or (D) the double mutant M513I + Δ896–903. Notice each mutation eliminates half of the channel's Ca2+-induced G-V shift. Each G-V curve is fitted with a Boltzmann function whose parameters where as follows. Wild-type: 0.003 μM [Ca2+] V1/2 = 200 mV, z = 0.93; 0.8 μM [Ca2+] V1/2 = 120 mV, z = 1.36; 10 μM [Ca2+] V1/2 = 32.8 mV, z = 1.18. M513I: 0.003 μM [Ca2+] V1/2 = 193 mV, z = 0.92; 0.8 μM [Ca2+] V1/2 = 140 mV, z = 1.16; 10 μM [Ca2+] V1/2 = 106 mV, z = 1.14. Δ896–903: 0.003 μM [Ca2+] V1/2 = 182 mV, z = 0.92; 0.8 μM [Ca2+] V1/2 = 149 mV, z = 1.17; 10 μM [Ca2+] V1/2 = 105 mV, z = 1.23. M513I + Δ896–903: 0.003 μM [Ca2+] V1/2 = 172 mV, z = 0.93; 0.8 μM [Ca2+] V1/2 = 164 mV, z = 1.05; 10 μM [Ca2+] V1/2 = 157 mV, z = 1.05. These data have been discussed previously in Bao et al. (2002). Error bars here and elsewhere indicate standard error of the mean.
F<sc>igure</sc> 3.
Figure 3.
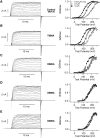
Three classes of Ca2+-bowl point mutants. Shown are data from (A) our control (M513I) channel, (B) a mutant that showed little change in Ca2+ response, (C) a mutant whose Ca2+ response was reduced by approximately half, and (D and E) two mutants whose responses to 10 μM [Ca2+] were essentially eliminated. On the left are current families (10 μM [Ca2+]) representative of those used to generate the G-V curves on the right. Voltages are as follows. Control (M513I): hold −50 mV, test 0–180 mV. T889A: hold −80 mV, test 0–180 mV. D895A: hold −50 mV, test 0–200 mV. D898A: hold −50 mV, test 40–220 mV. D900A: hold −50 mV, test 40–230 mV. All repolarization were to −80 mV. G-V Boltzmann fit parameters where as follows. Control: as in the legend to Fig. 2. T899A: 0.003 μM [Ca2+] V1/2 = 172 mV, z = 1.21; 0.8 μM [Ca2+] V1/2 = 135 mV, z = 1.46; 10 μM [Ca2+] V1/2 = 96 mV, z = 1.24. D895A: 0.003 μM [Ca2+] V1/2 = 181 mV, z = 1.24; 0.8 μM [Ca2+] V1/2 = 173 mV, z = 1.08; 10 μM [Ca2+] V1/2 = 138 mV, z = 1.42. D898A: 0.003 μM [Ca2+] V1/2 = 170 mV, z = 1.06; 0.8 μM [Ca2+] V1/2 = 169 mV, z = 1.14; 0.8 μM; 10 μM [Ca2+] V1/2 = 163 mV, z = 1.17. D900A: 0.003 μM [Ca2+] V1/2 = 182 mV, z = 1.34; 0.8 μM [Ca2+] V1/2 = 182 mV, z = 1.33; 10 μM [Ca2+] V1/2 = 169 mV, z = 1.22.
F<sc>igure</sc> 4.
Figure 4.
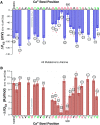
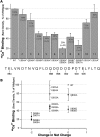
Summary of the effects of point mutations in the Ca2+ bowl. (A) Change in average V1/2 in response to increasing [Ca2+] from 0.003 to 10 μM for each of a series of point mutations to alanine in the Ca2+ bowl. Each mutated amino acid and its position in the Ca2+ bowl is indicated along the horizontal axis. Residues with acidic side-chains are indicated in red. Other oxygen-containing side chains are indicated in green. Side-chains without oxygen are indicated in black. Mutant responses that are statistically significant relative to control (far left) are indicated with an asterisk. The number of measurements (n) for each data point is indicated in parentheses with the upper number indicating n for 10 μM and the lower number indicating n for 0.003 μM [Ca2+]. (B) Effect of raising [Ca2+] from 0.003 to 10 μM on the free-energy difference between open and closed. −ΔΔGCa (0.003–10 μM [Ca2+]) values were determined from G-V fits to Eq. 2 as described in the text. The following constant parameters were used: J C(0) = 0.059; J O(0) = 1.020; z = 0.51; q = 0.4. The dataset used in B is the same as in A.
F<sc>igure</sc> 5.
Figure 5.
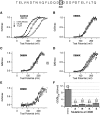
Ca2+ sensing is very sensitive to the nature of the residue at position 898. G-V curves determined for (A) the control (M513I) channel, and (B–E) four mutations at position 898 as indicated. (F) The effect of raising [Ca2+] from 0.003 μM to 10 μM on the free-energy difference between open and closed. −ΔΔGCa (0.003–10 μM [Ca2+]) values were determined as described in the text. Control: as in the legend to Fig. 2. D898A: as in the legend to Fig. 3. D898N: 0.003 μM [Ca2+] V1/2 = 172 mV, z = 1.28; 0.8 μM [Ca2+] V1/2 = 176 mV, z = 1.15; 10 μM [Ca2+] V1/2 = 168 mV, z = 1.16. D898K: 0.003 μM [Ca2+] V1/2 = 181 mV, z = 0.95; 0.8 μM [Ca2+] V1/2 = 184 mV, z = 1.02; 10 μM [Ca2+] V1/2 = 166 mV, z = 1.05. D898E: 0.003 μM [Ca2+] V1/2 = 214 mV, z = 1.15; 0.8 μM [Ca2+] V1/2 = 208 mV, z = 1.25; 10 μM [Ca2+] V1/2 = 191 mV, z = 1.35.
F<sc>igure</sc> 6.
Figure 6.
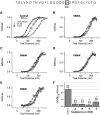
Ca2+ sensing is very sensitive to the nature of the residue at position 900. G-V curves determined for (A) the control (M513I) channel, and (B–E) four mutations at position 900 as indicated. (F) The effect of raising [Ca2+] from 0.003 to 10 μM on the free-energy difference between open and closed. −ΔΔGCa (0.003–10 μM [Ca2+]) values were determined as described in the text. Control as in the legend to Fig. 2. D900A: as in the legend to Fig. 3. D900N: 0.003 μM [Ca2+] V1/2 = 184 mV, z = 1.20; 0.8 μM [Ca2+] V1/2 = 183 mV, z = 1.04; 10 μM [Ca2+] V1/2 = 170 mV, z = 1.03. D900K: 0.003 μM [Ca2+] V1/2 = 163 mV, z = 1.26; 0.8 μM [Ca2+] V1/2 = 162 mV, z = 1.38; 10 μM [Ca2+] V1/2 = 154 mV, z = 1.13. D900E: 0.003 μM [Ca2+] V1/2 = 181 mV, z = 1.39; 0.8 μM [Ca2+] V1/2 = 178 mV, z = 1.39; 10 μM [Ca2+] V1/2 = 155 mV, z = 1.10.
F<sc>igure</sc> 7.
Figure 7.
Ca2+ bowl mutations greatly reduce Ca2+ binding to a mSlo fusion protein. (A, top) Ponceau-stained electroblot from and SDS-PAGE gel showing an increasing amount of loaded GST-mSlo207 fusion protein. On the far left 16 μg of GST alone was loaded as a negative control. (A, bottom) Autoradiogram of the blot in the top panel after 45Ca2+ overlay and wash. Note the increasing signal with increasing protein concentration. (B, top) Ponceau-stained blot from a gel that had loaded onto it 10 and 20 μg of GST-mSlo207 and the mutant GST-mSlo207-D898A/D900A as indicated. On the far left 16 μg of GST alone was loaded as a negative control. (B, bottom) Autoradiogram of the blot in the top panel after over lay with 12 μM 45Ca2+ and wash.
F<sc>igure</sc> 8.
Figure 8.
Ca2+ binding for a series of mutant fusion proteins. (A) 45Ca2+-band densities from overlay assays are plotted as a percentage of wild-type band density for each of ten GST-mSlo207 fusion proteins. (B) 45Ca2+-band density is plotted for each mutant fusion protein as a function of the change in net charge each mutation brings about. Open circles indicate mutations outside the central acidic region of the Ca2+ bowl (896–901). Closed circles indicate mutations inside this central region.
F<sc>igure</sc> 9.
Figure 9.
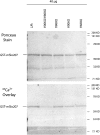
Ca2+ binding to four Ca2+-bowl mutant fusion proteins. (Top) Ponceau-stained blot from a gel that had loaded onto it 40 μg of GST-mSlo207 and the mutants GST-mSlo207-D898A/D900A, GST-mSlo207-D898A, GST-mSlo207-D900A, and GST-mSlo207-D899A as indicated. (Bottom) Autoradiogram of the blot in the top panel after 45Ca2+ overlay (9.1 μM [Ca2+]) and wash.
F<sc>igure</sc> 10.
Figure 10.
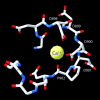
Hypothetical model of the Ca2+ bowl. Residues 896–907 of mSlo's Ca2+ bowl were positioned according to the backbone carbon trace of parvalbumin's first Ca2+-binding loop and energy minimized.

Comment in

References

    1. Adelman, J.P., K.Z. Shen, M.P. Kavanaugh, R.A. Warren, Y.N. Wu, A. Lagrutta, C.T. Bond, and R.A. North. 1992. Calcium-activated potassium channels expressed from cloned complementary DNAs. Neuron. 9:209–216. - PubMed
    1. Atkinson, N.S., G.A. Robertson, and B. Ganetzky. 1991. A component of calcium-activated potassium channels encoded by the Drosophila slo locus. Science. 253:551–555. - PubMed
    1. Babu, A., H. Su, and J. Gulati. 1993. The mechanism of Ca2+-coordination in the EF-hand of TnC, by cassette mutagenesis. Adv. Exp. Med. Biol. 332:125–131. - PubMed
    1. Babu, A., H. Su, Y. Ryu, and J. Gulati. 1992. Determination of residue specificity in the EF-hand of troponin C for Ca2+ coordination, by genetic engineering. J. Biol. Chem. 267:15469–15474. - PubMed
    1. Bandyopadhyay, J., J. Lee, J.I. Lee, J.R. Yu, C. Jee, J.H. Cho, S. Jung, M.H. Lee, S. Zannoni, A. Singson, et al. 2002. Calcineurin, a calcium/calmodulin-dependent protein phosphatase, is involved in movement, fertility, egg laying, and growth in Caenorhabditis elegans. Mol. Biol. Cell. 13:3281–3293. - PMC - PubMed

Publication types

MeSH terms

Substances