. 2004 Mar 18:5:31.
doi: 10.1186/1471-2105-5-31.

Defining transcriptional networks through integrative modeling of mRNA expression and transcription factor binding data

Affiliations

Defining transcriptional networks through integrative modeling of mRNA expression and transcription factor binding data

Feng Gao et al. BMC Bioinformatics. .

Abstract

Background: Functional genomics studies are yielding information about regulatory processes in the cell at an unprecedented scale. In the yeast S. cerevisiae, DNA microarrays have not only been used to measure the mRNA abundance for all genes under a variety of conditions but also to determine the occupancy of all promoter regions by a large number of transcription factors. The challenge is to extract useful information about the global regulatory network from these data.

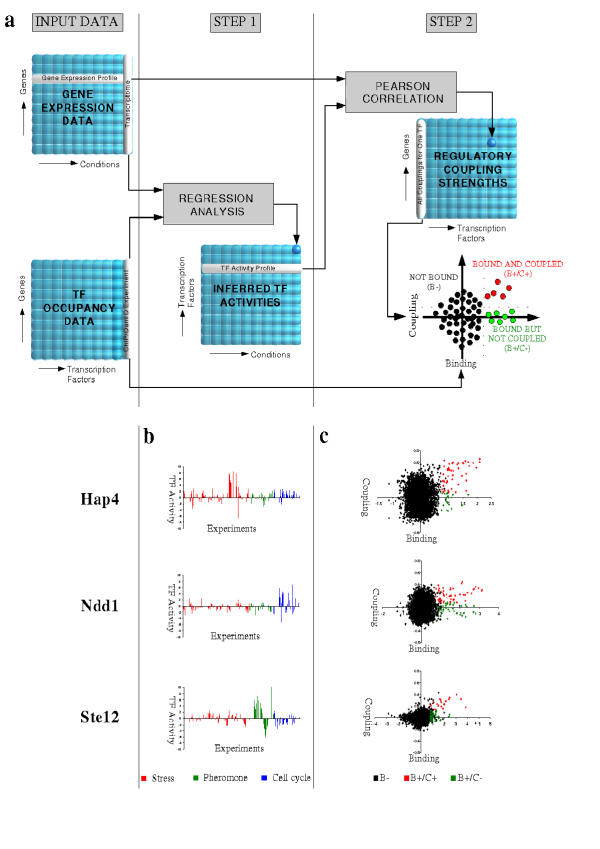
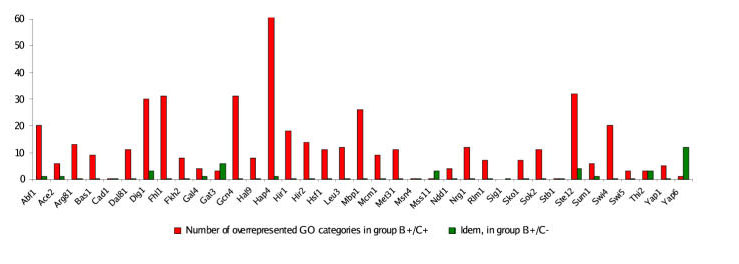
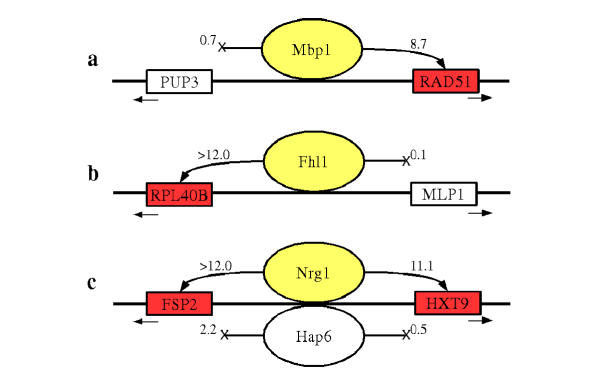
Results: We present MA-Networker, an algorithm that combines microarray data for mRNA expression and transcription factor occupancy to define the regulatory network of the cell. Multivariate regression analysis is used to infer the activity of each transcription factor, and the correlation across different conditions between this activity and the mRNA expression of a gene is interpreted as regulatory coupling strength. Applying our method to S. cerevisiae, we find that, on average, 58% of the genes whose promoter region is bound by a transcription factor are true regulatory targets. These results are validated by an analysis of enrichment for functional annotation, response for transcription factor deletion, and over-representation of cis-regulatory motifs. We are able to assign directionality to transcription factors that control divergently transcribed genes sharing the same promoter region. Finally, we identify an intrinsic limitation of transcription factor deletion experiments related to the combinatorial nature of transcriptional control, to which our approach provides an alternative.

Conclusion: Our reliable classification of ChIP positives into functional and non-functional TF targets based on their expression pattern across a wide range of conditions provides a starting point for identifying the unknown sequence features in non-coding DNA that directly or indirectly determine the context dependence of transcription factor action. Complete analysis results are available for browsing or download at http://bussemaker.bio.columbia.edu/papers/MA-Networker/.


Figures

Figure 1
Figure 1
(a) Overview of our method for determining regulatory coupling strengths between transcription factors and their putative target genes. Inputs are (i) a library of microarray expression data for a large number of conditions and (ii) genomewide (ChIP) occupancy data for one or more transcription factors. In the first step of our algorithm, a matrix of transcription factor activities is inferred by using regression analysis to explain the mRNA expression pattern under each condition in terms of the ChIP data for each transcription factor. In the second step, a matrix of regulatory coupling strengths is determined by computing the correlation between each transcription factor activity profile (TFAP) and the mRNA expression profile of each gene. (b) Examples of transcription factor activity profiles. The activity profiles of three transcription factors (Hap4, Ndd1, Ste12) are shown across stress response, pheromone response, and cell cycle [28-30]. Significant changes in activity of the TCA cycle regulator Hap4p occur mostly in metabolic stress conditions, while changes in the activity of the cell cycle regulator Ndd1p and the pheromone-dependent regulator Ste12p are associated with the cell cycle and signal transduction experiments, respectively. (c) Examples of scatter plots of ChIP binding log-ratio versus coupling factor. In the scatter plots, black dots denote unbound (B-) genes, red dots denote bound and coupled genes (B+/C+), while green dots denote genes that are bound but not coupled (B+/C-). A threshold of P = 10-3 was used to determine significant binding as described in Lee et al. [4]. A threshold for coupling was determined by requiring a false discovery rate of 5%, as described in Methods.
Figure 2
Figure 2
Enrichment for functional annotation. The number of significantly over-represented Gene Ontology (GO) categories in the group B+/C+ of genes that couple to transcription factor activity (red) and the group B+/C- of genes that do not couple (green) for each of the 37 transcription factors analyzed. No significant enrichment for any GO category was found in most B+/C- gene groups, supporting the hypothesis that only the coupling B+/C+ genes are functional targets.
Figure 3
Figure 3
Assigning directionality to divergently transcribed promoters. For pairs of divergently transcribed genes sharing a single promoter region occupied by one or more transcription factors, our method can be used to determine which gene is regulated by which factor. In the diagrams, genes are represented as squares with arrows showing the transcription direction; transcription factors are shown as ovals. The numbers shown are significance scores for the coupling between the transcription factor and the gene, equal to the negative 10-based logarithm of the P-value. Significant regulatory relationships are shown as arrows to colored boxes. In (A), the cell cycle transcription factor Mbp1p regulates the recombinase RAD51 but not the endopeptidase PUP3, while in (B), the putative rRNA processing regulator Fhl1p regulates the ribosomal subunit RPL40B but not the protein kinase MLP1. In the scenario illustrated in (C), both Nrg1p and Hap6p bind to the intergenic upstream region of FSP2 and HXT9. The coupling analysis shows that Nrg1p in this case works bi-directionally and regulates both genes, while Hap6p regulates neither gene.

Similar articles

Cited by

References

    1. Lockhart DJ, Dong H, Byrne MC, Follettie MT, Gallo MV, Chee MS, Mittmann M, Wang C, Kobayashi M, Horton H, Brown EL. Expression monitoring by hybridization to high-density oligonucleotide arrays. Nat Biotechnol. 1996;14:1675–1680. - PubMed
    1. Brown PO, Botstein D. Exploring the new world of the genome with DNA microarrays. Nat Genet. 1999;21:33–37. doi: 10.1038/4462. - DOI - PubMed
    1. Iyer VR, Horak CE, Scafe CS, Botstein D, Snyder M, Brown PO. Genomic binding sites of the yeast cell-cycle transcription factors SBF and MBF. Nature. 2001;409:533–538. doi: 10.1038/35054095. - DOI - PubMed
    1. Lee TI, Rinaldi NJ, Robert F, Odom DT, Bar-Joseph Z, Gerber GK, Hannett NM, Harbison CT, Thompson CM, Simon I, Zeitlinger J, Jennings EG, Murray HL, Gordon DB, Ren B, Wyrick JJ, Tagne JB, Volkert TL, Fraenkel E, Gifford DK, Young RA. Transcriptional regulatory networks in Saccharomyces cerevisiae. Science. 2002;298:799–804. doi: 10.1126/science.1075090. - DOI - PubMed
    1. van Steensel B, Delrow J, Henikoff S. Chromatin profiling using targeted DNA adenine methyltransferase. Nat Genet. 2001;27:304–308. doi: 10.1038/85871. - DOI - PubMed

Publication types

MeSH terms

LinkOut - more resources