

The limits of log-ratios
- PMID: 15113428
- PMCID: PMC400743
- DOI: 10.1186/1472-6750-4-3
The limits of log-ratios
Abstract
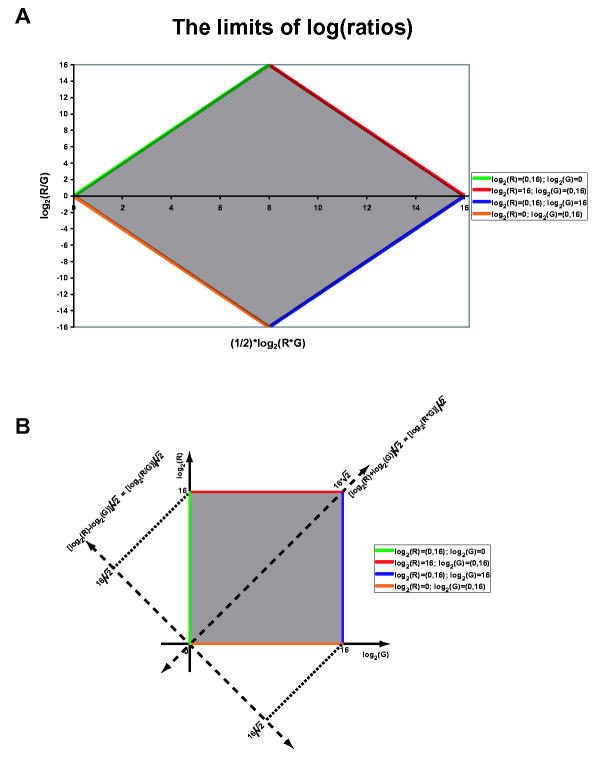
Background: DNA microarray assays typically compare two biological samples and present the results of those comparisons gene-by-gene as the logarithm base two of the ratio of the measured expression levels for the two samples.
Results: Because of the fixed dynamic range of fluorescence and other detection systems, there is a limit to the range of comparisons that can be made using any array technology, and this must be taken into account when interpreting the results of any such analysis.
Conclusions: The dynamic range of microarray data collection systems results in limits in the comparative analyses that can be derived from such measurements and suggests that optimal results can be obtained by making measurements that avoid the boundaries of that dynamic range.
Figures

 and
and  , followed by a simple rescaling to x" = [log2(R) + log2(G)]/2 and y" = [log2(R) - log2(G)].
Similar articles
-
Profound influence of microarray scanner characteristics on gene expression ratios: analysis and procedure for correction.BMC Genomics. 2004 Feb 3;5(1):10. doi: 10.1186/1471-2164-5-10. BMC Genomics. 2004. PMID: 15018648 Free PMC article.
-
CALIB: a Bioconductor package for estimating absolute expression levels from two-color microarray data.Bioinformatics. 2007 Jul 1;23(13):1700-1. doi: 10.1093/bioinformatics/btm159. Epub 2007 May 7. Bioinformatics. 2007. PMID: 17485432
-
Utilization of a labeled tracking oligonucleotide for visualization and quality control of spotted 70-mer arrays.BMC Genomics. 2004 Feb 9;5(1):12. doi: 10.1186/1471-2164-5-12. BMC Genomics. 2004. PMID: 15018646 Free PMC article.
-
Genomic profiling: cDNA arrays and oligoarrays.Methods Mol Biol. 2012;823:89-105. doi: 10.1007/978-1-60327-216-2_7. Methods Mol Biol. 2012. PMID: 22081341 Review.
-
Standards in gene expression microarray experiments.Methods Enzymol. 2006;411:63-78. doi: 10.1016/S0076-6879(06)11005-8. Methods Enzymol. 2006. PMID: 16939786 Review.
Cited by
-
Expression profiling of laser-microdissected intrapulmonary arteries in hypoxia-induced pulmonary hypertension.Respir Res. 2005 Sep 19;6(1):109. doi: 10.1186/1465-9921-6-109. Respir Res. 2005. PMID: 16171515 Free PMC article.
-
Evaluation of the External RNA Controls Consortium (ERCC) reference material using a modified Latin square design.BMC Biotechnol. 2016 Jun 24;16(1):54. doi: 10.1186/s12896-016-0281-x. BMC Biotechnol. 2016. PMID: 27342544 Free PMC article.
-
Effects of scanning sensitivity and multiple scan algorithms on microarray data quality.BMC Bioinformatics. 2010 Mar 12;11:127. doi: 10.1186/1471-2105-11-127. BMC Bioinformatics. 2010. PMID: 20226031 Free PMC article.
-
Invasive lobular and ductal breast carcinoma differ in immune response, protein translation efficiency and metabolism.Sci Rep. 2018 May 8;8(1):7205. doi: 10.1038/s41598-018-25357-0. Sci Rep. 2018. PMID: 29739984 Free PMC article.
-
Model selection and efficiency testing for normalization of cDNA microarray data.Genome Biol. 2004;5(8):R60. doi: 10.1186/gb-2004-5-8-r60. Epub 2004 Jul 30. Genome Biol. 2004. PMID: 15287982 Free PMC article.
References
-
- Saeed AI, Sharov V, White J, Li J, Liang W, Bhagabati N, Braisted J, Klapa M, Currier T, Thiagarajan M, Sturn A, Snuffin M, Rezantsev A, Popov D, Ryltsov A, Kostukovich E, Borisovsky I, Liu Z, Vinsavich A, Trush V, Quackenbush J. TM4: A Free, Open Source System for Microarray Data Management and Analysis. Biotechniques. 2003:374–378. - PubMed
Publication types
MeSH terms
Grants and funding
LinkOut - more resources
Full Text Sources
