. 2004 Apr 28;24(17):4124-33.
doi: 10.1523/JNEUROSCI.0172-04.2004.

The role of the frontal pursuit area in learning in smooth pursuit eye movements

Affiliations

The role of the frontal pursuit area in learning in smooth pursuit eye movements

I-Han Chou et al. J Neurosci. .

Abstract

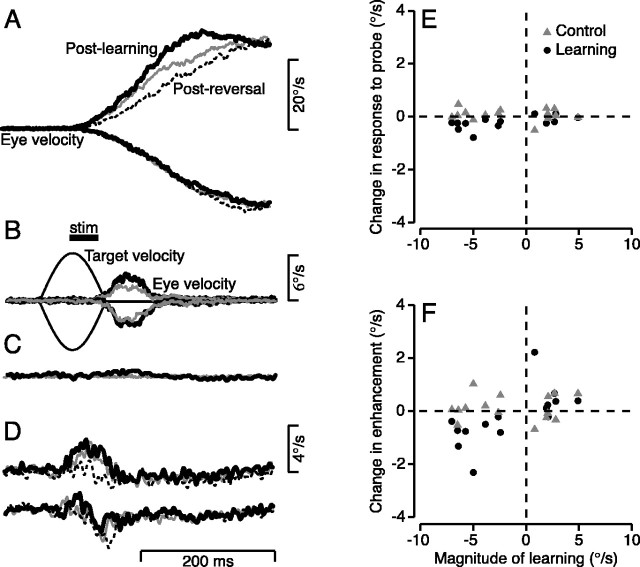
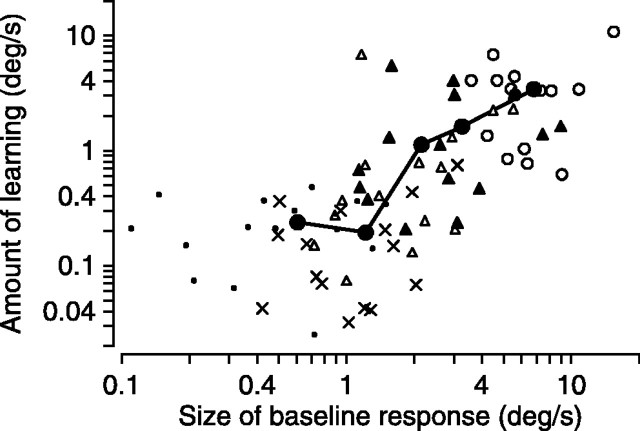
The frontal pursuit area (FPA) in the cerebral cortex is part of the circuit for smooth pursuit eye movements. The present paper asks whether the FPA is upstream, downstream, or at the site of learning in pursuit eye movements. Learning was induced by having monkeys repeatedly pursue targets that moved at one speed for 150 msec before changing speed. Single-cell recording showed no consistent correlate of pursuit learning in the responses of FPA neurons. Some neurons showed changes in firing in the same direction as the learning, others showed changes in the opposite direction, and many showed no changes at all. In contrast, the eye movements evoked by electrical stimulation of the FPA showed clear correlates of learning. Learning effects were observed when microstimulation was delivered during the initiation of pursuit and during fixation of a stationary target. In addition, learning caused changes in the degree to which stimulation of the FPA enhanced the eye velocity evoked by brief perturbations of a stationary target. The magnitude of the change in the stimulation-evoked eye movement in each tracking condition was proportional to the size of the eye movement evoked under that condition before learning. We conclude that learning occurs downstream from the FPA, possibly within the cerebellum, and that learning may be related to mechanisms that also control the gain of visual-motor responses on a rapid time scale.


Figures

Figure 1.
Figure 1.
Expression of learning in smooth pursuit eye movements. A (top to bottom), The superimposed traces show the time course of eye and target velocity for learning trials, reversal trials, probe trials, and control trials. The smooth traces with step changes show target velocity. The gray, bold black, and fine black traces show eye velocity before learning, after learning, and after the reversal block of trials. B, Quantitative analysis of the expression of learning in the initiation of pursuit. In the graph, each point shows data for an individual experiment and plots the effect of the learning conditions on the eye velocity in the control direction as a function of that in the learning direction. The horizontal and vertical histograms show the distributions of the size of the changes in eye velocity for target motion in the learning and control directions, respectively. The size of the learning effect was quantified by computing mean eye velocity in the first 200 msec of pursuit and subtracting the value after the reversal block of trials from that after the learning block of trials. Data are plotted at positive or negative values on the x-axis depending on whether the learning block was designed to cause increases or decreases in eye velocity at the initiation of pursuit.
Figure 2.
Figure 2.
Methods for analyzing the effects of microstimulation in the FPA. A, Responses to stimulation during the initiation of pursuit. Rectangular traces show target velocity. Gray and black traces show the eye velocity at the initiation of pursuit without and with microstimulation in the FPA. Upward and downward deflections indicate target motion to the right or left. B, Responses to simulation during fixation of a stationary target. Black and gray traces show the eye velocity of fixation with and without stimulation of the FPA. C, The black and gray traces show the effect of microstimulation during pursuit and fixation, respectively. The black trace was obtained by subtracting the eye velocity without stimulation from that with stimulation at each time point of the averages for rightward pursuit in A. In A-C, the short horizontal black bar indicates the time when stimulation was applied. D, Effect of pursuit direction on the eye movements evoked by microstimulation in the FPA. Each pair of traces is plotted at a position indicating the direction of target and eye motion at the time of stimulation. Black and gray traces plot the horizontal and vertical eye velocity and were obtained by computing the difference eye velocity as eye velocity with stimulation minus that without microstimulation at each time point of the averages. Upward deflections indicate leftward and upward eye motion. Each vector in the plot at the center of D shows the size and direction of the eye movement evoked by stimulation of the FPA during the initiation of pursuit for target motions indicated by the position of the vector. The central vector shows the eye movements evoked by stimulation during fixation.
Figure 3.
Figure 3.
Effect of pursuit learning on the eye movements evoked by stimulation of the FPA during the initiation of pursuit and during fixation. The three columns show the results of three different experiments. A-C, Magnitude of learning shown by averages of eye velocity during the initiation of pursuit in probe trials without microstimulation of the FPA. D-F, Averages of the difference eye velocity evoked by stimulation during the initiation of pursuit, obtained by subtracting the eye velocity without stimulation from that with stimulation at each time point of the averages. G-I, Averages of the eye velocity evoked by stimulation during fixation. In each panel, the gray, solid black, and dashed traces show eye velocity in baseline probe trials (pre-learning), in post-learning probe trials, and in post-reversal probe trials.
Figure 4.
Figure 4.
Quantitative analysis of the effect of pursuit learning on the eye movements evoked by microstimulation of the FPA. In each graph, each stimulation site is represented by two points: filled circles and open triangles show data obtained during pursuit in the learning and control directions. The difference between the stimulation-evoked eye velocities in the learning and reversal blocks is plotted as a function of the change in eye velocity during the initiation of pursuit without stimulation. A, Peak evoked eye velocity during the initiation of pursuit. B, Peak-to-peak evoked eye velocity during the initiation of pursuit. C, Peak evoked eye velocity during fixation.
Figure 5.
Figure 5.
Effect of learning on the multiplicative interaction of microstimulation in the FPA and visual inputs caused by brief target motions. A, Average eye velocity traces showing the expression of learning in the initiation of pursuit. Gray, bold, and dashed traces show responses in baseline probe trials (pre-learning), post-learning probe trials, and post-reversal probe trials. B, The smooth half-sine waves show the target velocity used to provide perturbations of target motion, and the rougher traces show averages of eye velocity evoked by the perturbations. Bold and thin traces show responses in the presence and absence of stimulation in the FPA. C, Bold and fine traces show average eye velocity evoked by microstimulation during fixation and the baseline during fixation. D, Enhanced component of eye velocity, computed by subtracting the response to the perturbation during fixation from that during stimulation at every millisecond in the averages. As in A, gray, bold, and dashed traces show responses in baseline probe trials (pre-learning), post-learning probe trials, and post-reversal probe trials. E, F, Two points are plotted for each experiment in each graph. Each point shows the effect of learning on the response to the perturbation as a function of the change in eye velocity at the initiation of pursuit. E, Responses to perturbations in the absence of stimulation. F, Responses to perturbations combined with stimulation of the FPA. Black circles and gray triangles show responses to perturbations in the learning and control directions, respectively. All effects of learning were calculated as the response in the post-learning probe block minus the response in the post-reversal probe block.
Figure 6.
Figure 6.
Relationship between the magnitude of the effect of learning on eye movements evoked by microstimulation in the FPA and the size of the baseline response. Individual symbols not connected by lines show responses for each of 5 stimulus conditions at 15 different stimulation sites. Large circles connected by lines show means across the 15 stimulation sites for each of the 5 stimulus conditions. From left to right, the five large filled circles and their associated individual symbols provide data for perturbations of target motion delivered during fixation without stimulation (small dots), stimulation of the FPA during fixation (X symbols), perturbations delivered during fixation with stimulation of the FPA (open triangles), peak responses for stimulation delivered during the initiation of pursuit (filled triangles), and peak-to-peak responses delivered during the initiation of pursuit (open circles). The graph is plotted in log-log coordinates to facilitate visualization of the data.
Figure 7.
Figure 7.
Absence of effect of learning on the responses of neurons in the FPA during the initiation of pursuit. A, Example responses of one neuron. From top to bottom, three rasters show pre-learning, post-learning, and post-reversal responses. Middle and bottom sets of traces show average firing rate and eye velocity during probe trials. Gray, bold, and dashed traces show responses in pre-learning, post-learning, and post-reversal probe trials. B, Method for assessing effect of learning on responses of FPA neurons in the context of the baseline relationship between firing rate and eye velocity in the initiation of pursuit. Gray symbols connected by a curve show the responses to targets moving at different speeds before learning. The three black squares show responses in probe trials before learning and after the learning and reversal blocks. Arrow points to the pre-learning response. Δ actual and Δ predicted indicate the changes in firing rate actually caused by learning and that predicted from the gray, speed tuning curve. C, Each point shows the response of a single FPA neuron and plots the effect of learning on firing rate as a function of the change in eye velocity at the initiation of pursuit. Arrow labeled “A” points to the analysis for the neuron illustrated in A. D, Each point plots the response of a single FPA neuron and shows the actual change in firing rate caused by learning as a function of that predicted by the speed tuning curve, using the analysis outlined in B. The horizontal and vertical dashed lines indicate predicted and actual changes of zero, and the line of slope one indicates where points should plot if the predicted and actual changes in response are identical. All effects of learning were calculated as the response in the post-learning probe block minus the response in the post-reversal probe block.
Figure 8.
Figure 8.
Schematic diagram showing the conceptual organization of the pursuit system. Signals flow along the arrows, which are numbered to allow easy reference in the text. Circles labeled MT/MST, FPA, and Cb are intended to represent extrastriate visual areas MT and MST, the frontal pursuit area, and the cerebellum. The circles with a plus sign or an X in them perform addition or multiplication.

Similar articles

Cited by

References

    1. Chou IH, Lisberger SG (2002) Spatial generalization of learning in smooth pursuit eye movements: implications for the coordinate frame and sites of learning. J Neurosci 22: 4728-4739. - PMC - PubMed
    1. Churchland AK, Lisberger SG (2002) Gain control in human smooth-pursuit eye movements. J Neurophysiol 87: 2936-2945. - PMC - PubMed
    1. Cui DM, Yan YJ, Lynch JC (2003) Pursuit subregion of the frontal eye field projects to the caudate nucleus in monkeys. J Neurophysiol 89: 2678-2684. - PubMed
    1. Desmurget M, Pelisson D, Grethe JS, Alexander GE, Urquizar C, Prablanc C, Grafton ST (2000) Functional adaptation of reactive saccades in humans: a PET study. Exp Brain Res 132: 243-259. - PubMed
    1. Dursteler MR, Wurtz RH (1988) Pursuit and optokinetic deficits following chemical lesions of cortical areas MT and MST. J Neurophysiol 60: 940-965. - PubMed

Publication types