

Sequential exocytosis of insulin granules is associated with redistribution of SNAP25
- PMID: 15117968
- PMCID: PMC2172050
- DOI: 10.1083/jcb.200312033
Sequential exocytosis of insulin granules is associated with redistribution of SNAP25
Abstract
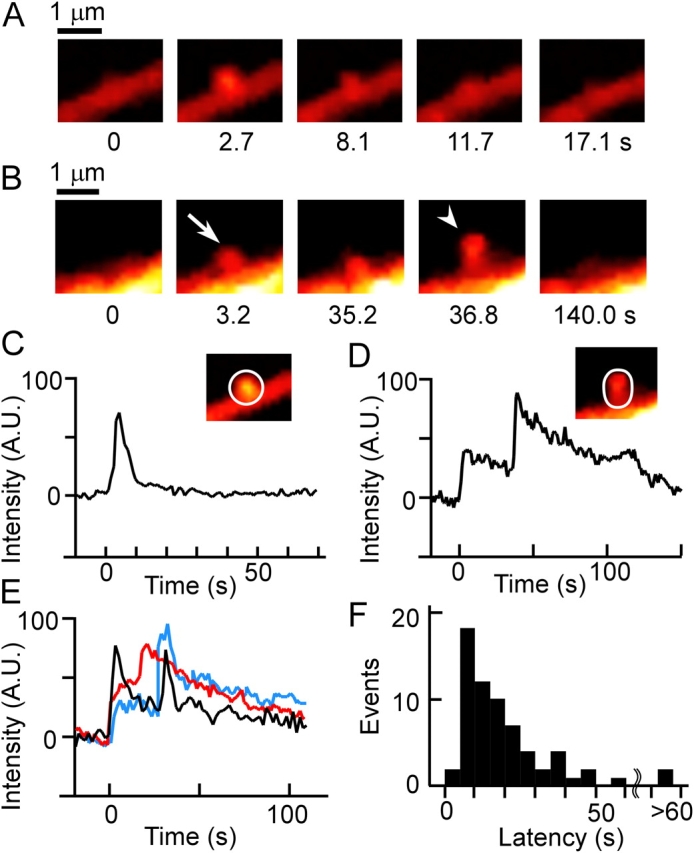
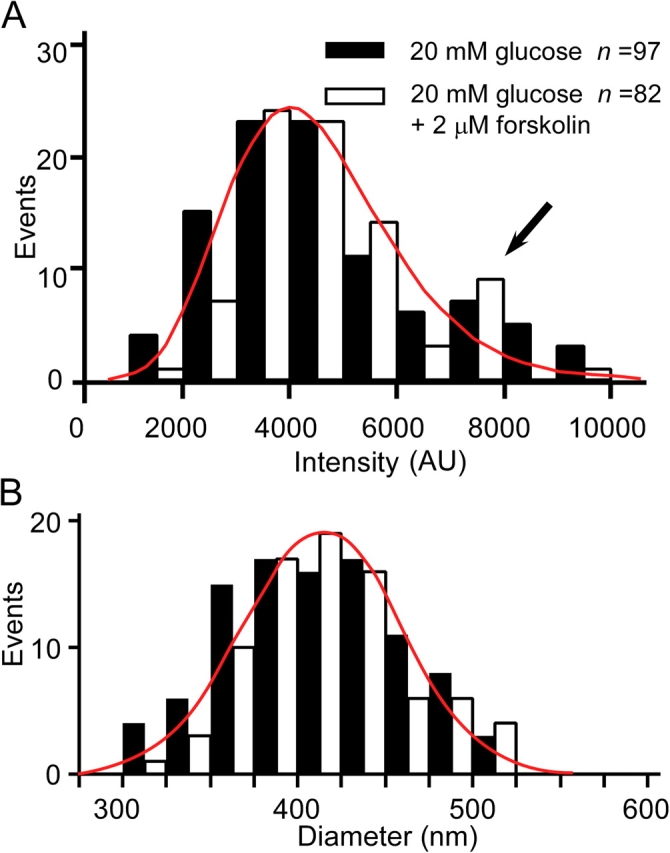
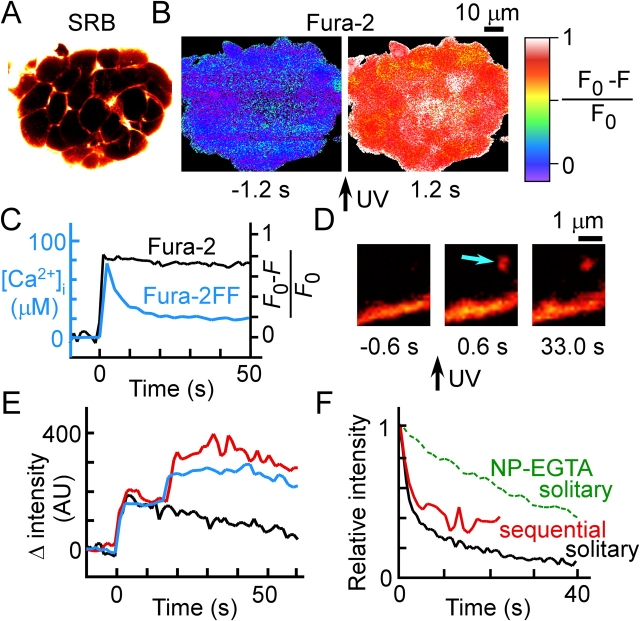
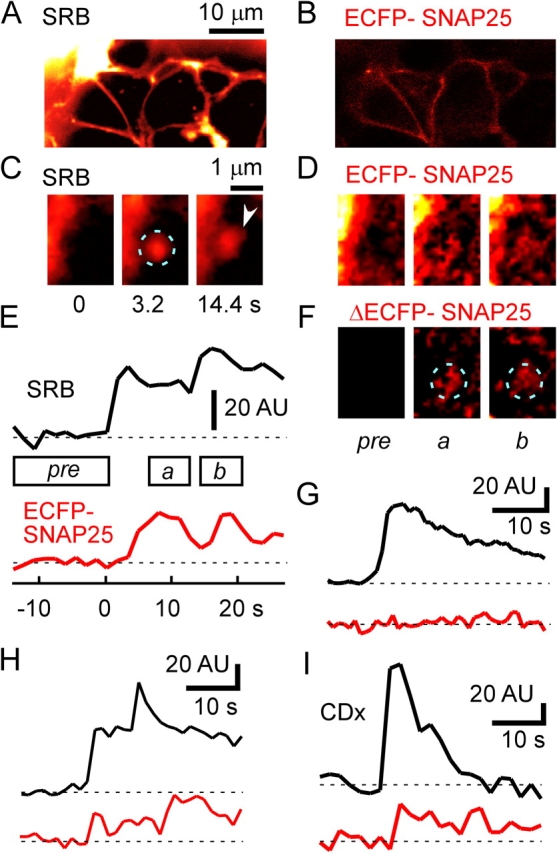
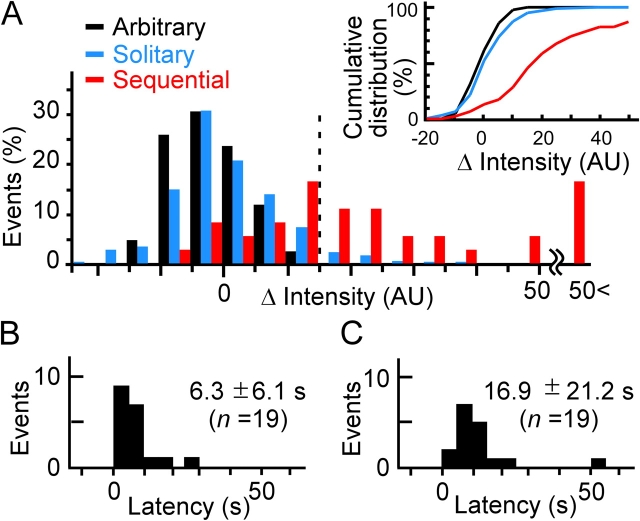
We have investigated sequential exocytosis in beta cells of intact pancreatic islets with the use of two-photon excitation imaging of a polar fluorescent tracer, sulforhodamine B, and a fusion protein comprising enhanced cyan fluorescent protein (ECFP) and the SNARE protein SNAP25 (synaptosome-associated protein of 25 kD) transfected with an adenoviral vector. Sequential exocytosis was found to account for <10% of exocytic events in beta cells stimulated either with glucose under various conditions or by photolysis of a caged-Ca2+ compound. Multigranular exocytosis, in which granule-to-granule fusion occurs before exocytosis, was rarely found. We detected redistribution of ECFP-SNAP25 from the plasma membrane into the membrane of the fused granule occurred in a large proportion (54%) of sequential exocytic events but in only a small fraction (5%) of solitary fusion events. Removal of cholesterol in the plasma membrane by methyl-beta-cyclodextrin facilitated both redistribution of ECFP-SNAP25 and sequential exocytosis by threefold. These observations support the hypothesis that SNAP25 is a plasma membrane factor that is responsible for sequential exocytosis.
Figures
Similar articles
-
Site of docking and fusion of insulin secretory granules in live MIN6 beta cells analyzed by TAT-conjugated anti-syntaxin 1 antibody and total internal reflection fluorescence microscopy.J Biol Chem. 2004 Feb 27;279(9):8403-8. doi: 10.1074/jbc.M308954200. Epub 2003 Dec 15. J Biol Chem. 2004. PMID: 14676208
-
SNAREs are concentrated in cholesterol-dependent clusters that define docking and fusion sites for exocytosis.EMBO J. 2001 May 1;20(9):2202-13. doi: 10.1093/emboj/20.9.2202. EMBO J. 2001. PMID: 11331586 Free PMC article.
-
Exocytic process analyzed with two-photon excitation imaging in endocrine pancreas.Endocr J. 2007 Jun;54(3):337-46. doi: 10.1507/endocrj.kr-94. Epub 2007 Apr 3. Endocr J. 2007. PMID: 17409577 Review.
-
Visualization of sequential exocytosis in rat pancreatic islet beta cells.Biochem Biophys Res Commun. 2002 Apr 12;292(4):980-6. doi: 10.1006/bbrc.2002.6712. Biochem Biophys Res Commun. 2002. PMID: 11944911
-
Imaging analysis of insulin secretion with two-photon microscopy.Biol Pharm Bull. 2015;38(5):656-62. doi: 10.1248/bpb.b14-00880. Biol Pharm Bull. 2015. PMID: 25947910 Review.
Cited by
-
Function suggests nano-structure: electrophysiology supports that granule membranes play dice.J R Soc Interface. 2012 Oct 7;9(75):2516-26. doi: 10.1098/rsif.2012.0161. Epub 2012 May 23. J R Soc Interface. 2012. PMID: 22628211 Free PMC article.
-
Recent Insights into Beta-cell Exocytosis in Type 2 Diabetes.J Mol Biol. 2020 Mar 6;432(5):1310-1325. doi: 10.1016/j.jmb.2019.12.012. Epub 2019 Dec 19. J Mol Biol. 2020. PMID: 31863749 Free PMC article. Review.
-
NOVEL GENETIC FINDINGS IN A CHINESE FAMILY WITH EARLY-ONSET FEMALE-RELATED TYPE 2 DIABETES.Acta Endocrinol (Buchar). 2017 Jul-Sep;13(3):364-369. doi: 10.4183/aeb.2017.364. Acta Endocrinol (Buchar). 2017. PMID: 31149201 Free PMC article.
-
Multivesicular exocytosis in rat pancreatic beta cells.Diabetologia. 2012 Apr;55(4):1001-12. doi: 10.1007/s00125-011-2400-5. Epub 2011 Dec 22. Diabetologia. 2012. PMID: 22189485 Free PMC article.
-
Deploying insulin granule-granule fusion to rescue deficient insulin secretion in diabetes.Diabetologia. 2012 Apr;55(4):877-80. doi: 10.1007/s00125-012-2483-7. Epub 2012 Feb 4. Diabetologia. 2012. PMID: 22307686
References
-
- Bokvist, K., M. Holmqvist, J. Gromada, and P. Rorsman. 2000. Compound exocytosis in voltage-clamped mouse pancreatic beta-cells revealed by carbon fibre amperometry. Pflugers Arch. 439:634–645. - PubMed
Publication types
MeSH terms
Substances
LinkOut - more resources
Full Text Sources
Medical
Miscellaneous
