

Imaging correlates of brain function in monkeys and rats isolates a hippocampal subregion differentially vulnerable to aging
- PMID: 15118105
- PMCID: PMC406486
- DOI: 10.1073/pnas.0400285101
Imaging correlates of brain function in monkeys and rats isolates a hippocampal subregion differentially vulnerable to aging
Abstract
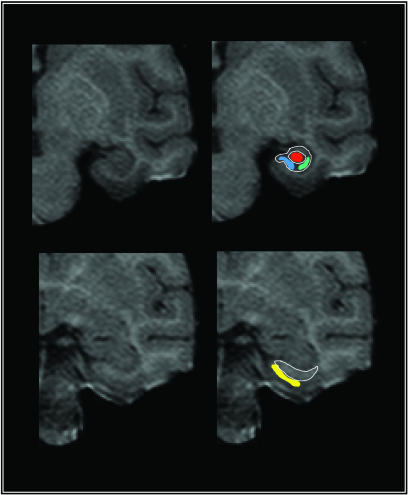
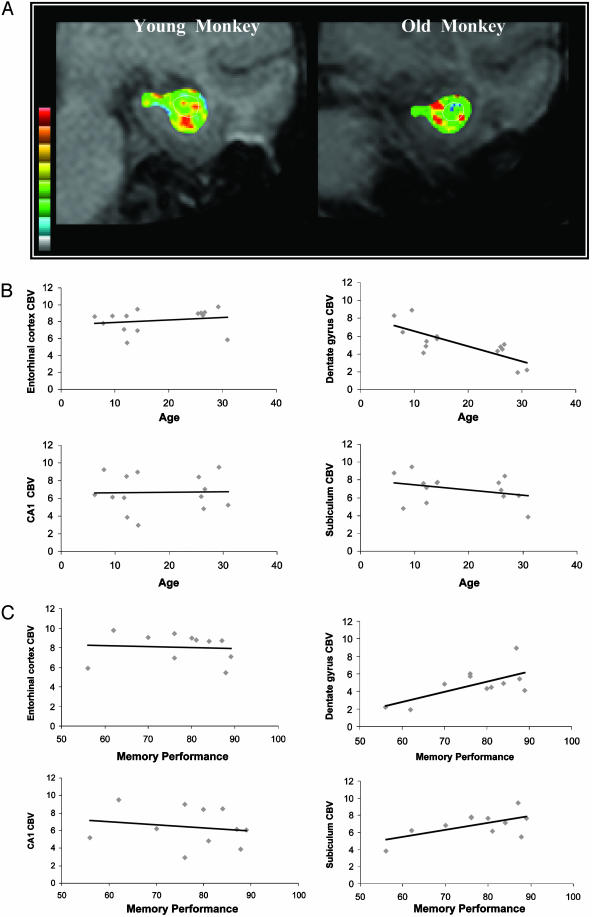
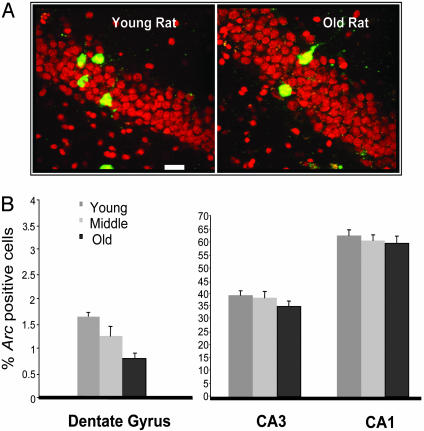
The hippocampal formation contains a distinct population of neurons organized into separate anatomical subregions. Each hippocampal subregion expresses a unique molecular profile accounting for their differential vulnerability to mechanisms of memory dysfunction. Nevertheless, it remains unclear which hippocampal subregion is most sensitive to the effects of advancing age. Here we investigate this question by using separate imaging techniques, each assessing different correlates of neuronal function. First, we used MRI to map cerebral blood volume, an established correlate of basal metabolism, in the hippocampal subregions of young and old rhesus monkeys. Second, we used in situ hybridization to map Arc expression in the hippocampal subregions of young and old rats. Arc is an immediate early gene that is activated in a behavior-dependent manner and is correlated with spike activity. Results show that the dentate gyrus is the hippocampal subregion most sensitive to the effects of advancing age, which together with prior studies establishes a cross-species consensus. This pattern isolates the locus of age-related hippocampal dysfunction and differentiates normal aging from Alzheimer's disease.
Figures
References
-
- Barnes, C. A. (1994) Trends Neurosci. 17, 13-18. - PubMed
-
- Gallagher, M. & Rapp, P. R. (1997) Annu. Rev. Psychol. 48, 339-370. - PubMed
-
- Small, S. A., Stern, Y., Tang, M. & Mayeux, R. (1999) Neurology 52, 1392-1396. - PubMed
-
- Amaral, D. G. & Witter, M. P. (1989) Neuroscience 31, 571-591. - PubMed
-
- Zhao, X., Lein, E. S., He, A., Smith, S. C., Aston, C. & Gage, F. H. (2001) J. Comp. Neurol. 441, 187-196. - PubMed
Publication types
MeSH terms
Grants and funding
- RR000169/RR/NCRR NIH HHS/United States
- R01 AG010606/AG/NIA NIH HHS/United States
- P51 RR000169/RR/NCRR NIH HHS/United States
- AG08702/AG/NIA NIH HHS/United States
- R37 AG010606/AG/NIA NIH HHS/United States
- AG003376/AG/NIA NIH HHS/United States
- R56 AG003376/AG/NIA NIH HHS/United States
- R01 AG003376/AG/NIA NIH HHS/United States
- Z01 AG000949/ImNIH/Intramural NIH HHS/United States
- AG10606/AG/NIA NIH HHS/United States
- K24 AG000949/AG/NIA NIH HHS/United States
- P50 AG008702/AG/NIA NIH HHS/United States
- R01 AG009219/AG/NIA NIH HHS/United States
- AG09219/AG/NIA NIH HHS/United States
LinkOut - more resources
Full Text Sources
Other Literature Sources
Medical
