. 2004 May;24(10):4321-8.
doi: 10.1128/MCB.24.10.4321-4328.2004.

Network of dynamic interactions between histone H1 and high-mobility-group proteins in chromatin

Affiliations

Network of dynamic interactions between histone H1 and high-mobility-group proteins in chromatin

Frédéric Catez et al. Mol Cell Biol. 2004 May.

Abstract

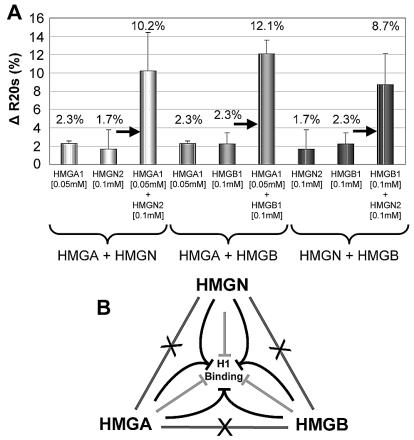
Histone H1 and the high-mobility group (HMG) proteins are chromatin binding proteins that regulate gene expression by modulating the compactness of the chromatin fiber and affecting the ability of regulatory factors to access their nucleosomal targets. Histone H1 stabilizes the higher-order chromatin structure and decreases nucleosomal access, while the HMG proteins decrease the compactness of the chromatin fiber and enhance the accessibility of chromatin targets to regulatory factors. Here we show that in living cells, each of the three families of HMG proteins weakens the binding of H1 to nucleosomes by dynamically competing for chromatin binding sites. The HMG families weaken H1 binding synergistically and do not compete among each other, suggesting that they affect distinct H1 binding sites. We suggest that a network of dynamic and competitive interactions involving HMG proteins and H1, and perhaps other structural proteins, constantly modulates nucleosome accessibility and the local structure of the chromatin fiber.


Figures

FIG. 1.
FIG. 1.
(A) Competitors used in this study. A representation of the proteins and protein fragments injected is shown. The relative DNA or chromatin binding activity of each protein is indicated on the right (see text for reference). (B) Coomassie blue staining of an SDS-PAGE gel containing the proteins used in this study. M, molecular size markers (sizes are in kilodaltons). (C) All of the injected HMG proteins accumulate within the nucleus (for HMGN, see reference 47). HMG proteins or fragments, each at a 0.4 mM final concentration, were mixed with Texas red-labeled dextran and injected into the cytoplasm of mouse fibroblasts. The HMG injected into the cell is indicated at the top of each column. The cells were fixed 1 h after injection, immunostained with appropriate antibodies, and examined by confocal microscopy. The left side of each row indicates the image visualized. The pseudocolored images of anti-HMG immunostaining emphasize the significant increase in the protein concentration in the nuclei of the injected cells. Note that these are confocal images and do not accurately reflect the quantitative increase in protein. The scale indicates the color code used, from blue (low intensity) to red (high intensity). Bars, 5 μm.
FIG. 2.
FIG. 2.
HMG proteins decrease H1°-GFP binding to chromatin. (A) FRAP assay of H1°-GFP-expressing cells showing the fluorescence signal (top) and enlarged pseudocolored images of the boxed area (bottom). Bleached areas are circled. Bar, 5 μm. (B) Confocal imaging of live H1°-GFP-expressing cells injected with a solution containing Texas red-labeled injection marker. (C) Quantitative FRAP analysis of H1°-GFP-expressing cells either left uninjected (blue curves) or injected (red curves) with a 0.4 mM solution of HMGB1, HMGN2, HMGB1-A box, HMGB1-B box, or HMGB1-A+B box or a 0.2 mM solution of HMGA1. The time required to reach 40% recovery (t40) is indicated by blue and red arrows, and the statistical significance (t test) is indicated. The difference in recovery between the two curves (ΔR20s) is indicated next to the curves. The boxes above each graph of the upper panel outline the main functional domains characteristic of each injected HMG family. The boxes above each graph of the lower panel outline the HMGB1 segments injected. (D) Graph outlining the kinetic parameters measured (see text). (E) Dose-dependent increase in ΔR20s of H1°-GFP upon injection of the indicated concentration of an HMG protein.
FIG. 3.
FIG. 3.
HMG proteins decrease the H1°-GFP binding in euchromatin and heterochromatin. Quantitative FRAP analysis of H1°-GFP-expressing cells either left uninjected (gray curves) or injected (black curves) with a 0.4 mM solution of HMGB1 (A and B) or with 0.2 mM HMGA1 (C and D). FRAP analysis was performed on either euchromatin (A and C) or heterochromatin (B and D). Gray and black arrows indicate the t80 values, and the statistical significance (t test) is indicated.
FIG. 4.
FIG. 4.
HMG proteins from different families do not compete with each other. The fluorescent target and the fluorescence recovery curves of the target determined in the absence of an injected competitor are gray. The fluorescence recovery curves determined in the presence of an indicated competitor are black. Gray and black arrows indicate the t80, and the statistical significance (t test) is indicated. The ΔR20s is indicated next to the curves.
FIG. 5.
FIG. 5.
HMG proteins act synergistically to compete with H1 for chromatin binding. (A) Shown are the ΔR20s values between uninjected and injected cells expressing H1°-GFP (see Fig. 2D). The concentration of the injected proteins is indicated below each bar. (B) Scheme of the H1-HMG chromatin binding network. The lines connecting the HMG families, crossed by an X, indicate lack of competition between members of different HMG families. The light gray lines indicate that, by itself, each of the HMG families reduces the binding of H1 to chromatin. The converging black lines indicate that members of distinct HMG families weaken the binding of H1 to chromatin synergistically. The scheme points emphasize that H1 is a target common to all of the HMG proteins.

References

    1. Agresti, A., and M. E. Bianchi. 2003. HMGB proteins and gene expression. Curr. Opin. Genet. Dev. 13:170-178. - PubMed
    1. Alami, R., Y. Fan, S. Pack, T. M. Sonbuchner, A. Besse, Q. Lin, J. M. Greally, A. I. Skoultchi, and E. E. Bouhassira. 2003. Mammalian linker-histone subtypes differentially affect gene expression in vivo. Proc. Natl. Acad. Sci. USA 100:5920-5925. - PMC - PubMed
    1. Ashar, H. R., M. Schoenberg Fejzo, A. Tkachenko, X. Zhou, J. A. Fletcher, S. Weremowicz, C. C. Morton, and K. Chada. 1995. Disruption of the architectural factor HMGI-C: DNA-binding AT hook motifs fused in lipomas to distinct transcriptional regulatory domain. Cell 82:57-65. - PubMed
    1. Battista, S., F. Pentimalli, G. Baldassarre, M. Fedele, V. Fidanza, C. M. Croce, and A. Fusco. 2003. Loss of Hmga1 gene function affects embryonic stem cell lympho-hematopoietic differentiation. FASEB J. 17:1496-1498. - PubMed
    1. Beaujean, N., C. Bouniol-Baly, C. Monod, K. Kissa, D. Jullien, N. Aulner, C. Amirand, P. Debey, and E. Kas. 2000. Induction of early transcription in one-cell mouse embryos by microinjection of the non-histone chromosomal protein HMG-I. Dev. Biol. 221:337-354. - PubMed

LinkOut - more resources