. 2004 May;24(10):4329-40.
doi: 10.1128/MCB.24.10.4329-4340.2004.

Hip1-related mutant mice grow and develop normally but have accelerated spinal abnormalities and dwarfism in the absence of HIP1

Affiliations

Hip1-related mutant mice grow and develop normally but have accelerated spinal abnormalities and dwarfism in the absence of HIP1

Teresa S Hyun et al. Mol Cell Biol. 2004 May.

Abstract

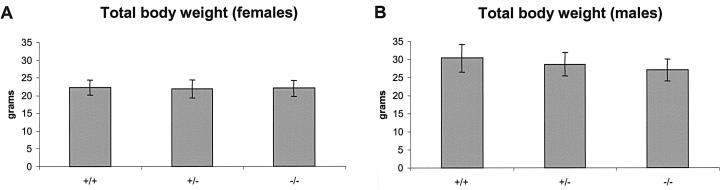
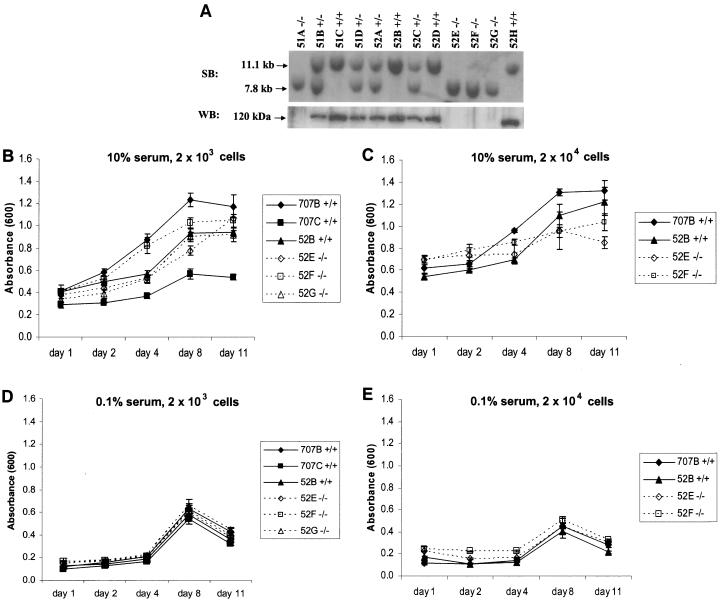
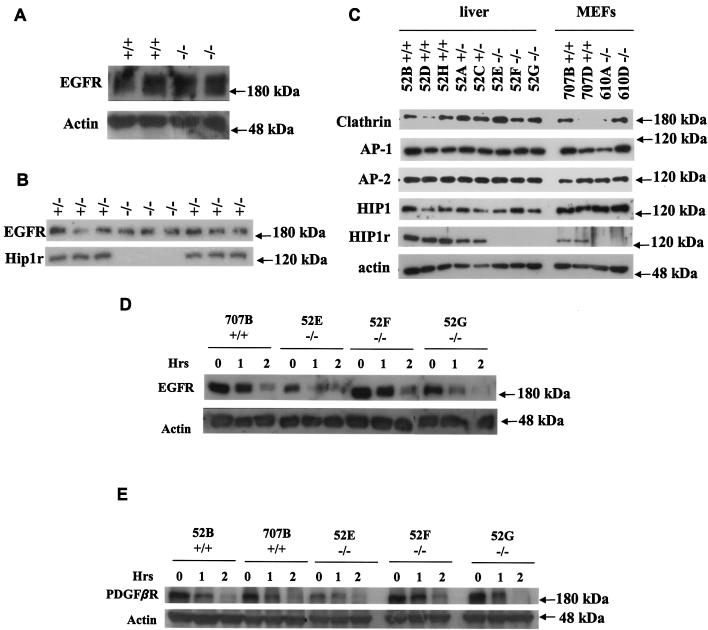
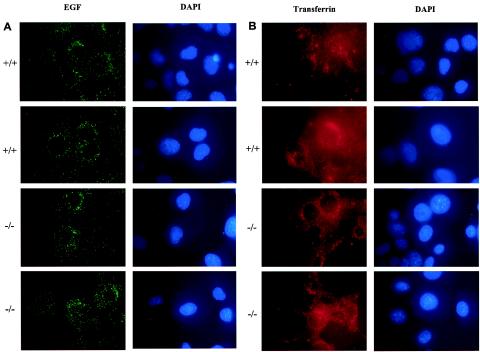
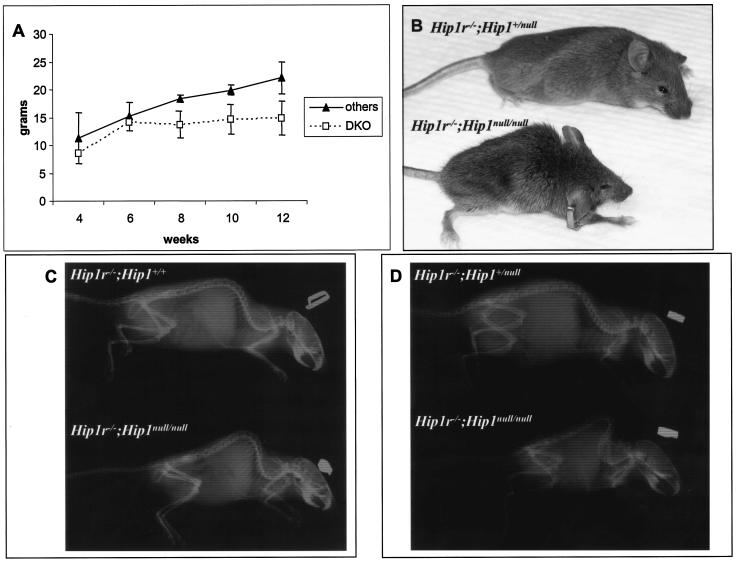
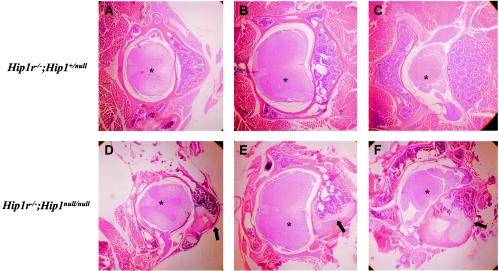
In mice and humans, there are two known members of the Huntingtin interacting protein 1 (HIP1) family, HIP1 and HIP1-related (HIP1r). Based on structural and functional data, these proteins participate in the clathrin trafficking network. The inactivation of Hip1 in mice leads to spinal, hematopoietic, and testicular defects. To investigate the biological function of HIP1r, we generated a Hip1r mutant allele in mice. Hip1r homozygous mutant mice are viable and fertile without obvious morphological abnormalities. In addition, embryonic fibroblasts derived from these mice do not have gross abnormalities in survival, proliferation, or clathrin trafficking pathways. Altogether, this demonstrates that HIP1r is not necessary for normal development of the embryo or for normal adulthood and suggests that HIP1 or other functionally related members of the clathrin trafficking network can compensate for HIP1r absence. To test the latter, we generated mice deficient in both HIP1 and HIP1r. These mice have accelerated development of abnormalities seen in Hip1 -deficient mice, including kypholordosis and growth defects. The severity of the Hip1r/Hip1 double-knockout phenotype compared to the Hip1 knockout indicates that HIP1r partially compensates for HIP1 function in the absence of HIP1 expression, providing strong evidence that HIP1 and HIP1r have overlapping roles in vivo.


Figures

FIG. 1.
FIG. 1.
HIP1r expression in normal human tissues. Photomicrographs of a normal human tissue microarray stained with anti-HIP1r MAb 1E1. Examples of tissues with high (brain, bone marrow, pancreas, pituitary, small intestine, stomach, spleen, thyroid, and tonsil), moderate (skin, kidney, ventricular muscle, and prostate), and low (peripheral nerve and colon) HIP1r staining are shown.
FIG. 2.
FIG. 2.
Disruption of the murine Hip1r gene by homologous recombination. (A) Hip1r targeting strategy. Hip1r exons 2 to 8 were replaced by the neomycin resistance gene in the opposite orientation as the Hip1r gene in the targeted allele. The genomic sequences recognized by the 5′ and 3′ Southern blot probes are shown (5′ probe and 3′ probe). K, KpnI; Ap, ApaI; B, BamHI; E, EcoRI; Rv, EcoRV; H, HindIII; S, SacI; Sp, SpeI; X, XbaI; Xh, XhoI. (B) Genotype analysis of the F2 generation. Representative BamHI-digested genomic DNA fragments detected by hybridization with the 3′ Southern blot probe are shown. (C) Northern blot analysis of mouse brain. Hybridization of poly(A) mRNA with a mouse Hip1r cDNA probe identified the 4.4-kb Hip1r mRNA transcript (top panel). The neomycin probe recognized a 2.2-kb transcript corresponding to the neomycin-resistant mRNA transcript (middle panel). GAPDH was used as a loading control (bottom panel). (D) Western blot analysis. Tissue extracts of organs from wild-type (top panel) and Hip1r−/− (bottom panel) mice were blotted with anti-HIP1r polyclonal antibody UM359.
FIG. 3.
FIG. 3.
Growth analysis of Hip1r−/− mice. (A) Average weights of adult female (>8 weeks old) Hip1r+/+ (n = 12), Hip1r+/− (n = 32) and Hip1r−/− (n = 31) mice. (B) Average weights of adult male (>8 weeks old) Hip1r+/+ (n = 15), Hip1r+/− (n = 31), and Hip1r−/− (n = 9). Error bars represent standard deviations.
FIG. 4.
FIG. 4.
Growth analysis of Hip1r−/− MEFs. (A) Southern blot of MEF lines established from the F2 generation hybridized with the 3′ HIP1r probe (top panel). The same MEF lines were analyzed by Western blot with the anti-HIP1r antibody UM359 (bottom panel). Note the intermediate expression levels of HIP1r in the heterozygous cell lines. (B) Growth analysis of MEFs in 10% serum by MTT assay. Cells were plated at 2 × 10³ per well in quadruplicate and analyzed for 11 days. (C) Growth analysis after plating 2 × 10⁴ cells per well in 10% serum. (D to E) Growth analysis of MEFs in 0.1% serum. Cells were plated at 2 × 10³ (D) or 2 × 10⁴ (E) cells per well.
FIG. 5.
FIG. 5.
Growth factor receptor levels and endocytosis in Hip1r−/− cells. (A) EGFR levels in the epidermis of Hip1r−/− mice. A total of 100 μ g of protein was separated by SDS-PAGE, and EGFR levels were detected by using anti-EGFR sheep polyclonal antibody. (B) Keratinocytes were isolated from newborn Hip1r homozygous or heterozygous mutant mice and lysed 2 days after plating, and 50 μ g of protein was separated by SDS-PAGE. EGFR levels were detected with anti-EGFR sheep polyclonal antibody. (C) Expression of endocytic proteins in livers from Hip1r−/− embryos (isolated when MEF lines were created) and Hip1r−/− MEFs. A total of 50 μ g of protein was run on 8% gels and then blotted for the clathrin heavy chain, the γ subunit of AP-1, the α subunit of AP-2, HIP1, and HIP1r. (D) EGFR half-life in Hip1r−/− MEFs after starvation and stimulation with 100 ng of EGF/ml. Lysates were separated by SDS-PAGE, transferred to nitrocellulose, and blotted with anti-EGFR sheep polyclonal antibody. (E) PDGF β R levels in Hip1r−/− MEFs after starvation and stimulation with 50 ng of PDGF ββ /ml. PDGF β R was detected with an anti-PDGF β R polyclonal antibody. Actin levels were used as a loading control.
FIG. 6.
FIG. 6.
Endocytosis in Hip1r−/− MEFs. (A) Immunofluorescence of EGF internalization in Hip1r+/+ and Hip1r−/− MEFs. Cells were starved overnight, incubated with Alexa Fluor 488-EGF (green) at 4°C for 1 h, and then shifted to 37°C for 30 min. Nuclei were visualized by DAPI staining. Two representative fields from wild-type MEFs (first and second rows) and homozygous Hip1r -null MEFs (third and fourth rows) are shown. (B) Immunofluorescence of transferrin internalization in Hip1r+/+ and Hip1r−/− MEFs. Cells were starved for 3 h, incubated with Texas red-transferrin (red) at 4°C for 1 h, and then shifted to 37°C for 30 min. Two representative fields from Hip1r+/+ MEFs (first and second rows) and Hip1r−/− MEFs (third and fourth rows) are shown.
FIG. 7.
FIG. 7.
Dwarfism and kypholordosis in Hip1r−/−; Hip1null/null mice. (A) Growth curve of female Hip1r/Hip1 mutant mice. Hip1r−/−; Hip1null/null mice are shown (n = 4) in comparison to all other female littermates that had at least one normal Hip1r or Hip1 allele (Hip1r+/−; Hip1+/null, Hip1r+/−; Hip1null/null, Hip1r−/−; Hip1+/null, and Hip1r−/−; Hip1+/+) as indicated (n = 11). The male double-mutant mice (n = 3) were also obviously dwarfed compared to their littermate controls (n = 8) (data not shown). (B) Representative photograph of two 13-week-old female littermates. Note the reduced body mass and kypholordosis of the Hip1r−/−; Hip1null/null mouse (bottom) compared to its Hip1r−/−; Hip1+/null littermate (top). (C) Radiograph of 14-week-old female littermates. The Hip1r−/−; Hip1null/null mouse (lower panel) show the severe spinal deformity compared to its Hip1r−/−; Hip1+/+ littermate. (D) Radiographs of 6-week-old male littermates. The Hip1r−/−; Hip1null/null mouse (lower panel) show the severe spinal deformity compared to its Hip1r−/−; Hip1+/null littermate.
FIG. 8.
FIG. 8.
Histology of spinal deformity in Hip1r−/−; Hip1null/null mice. (A to C) Hematoxylin and eosin staining of Hip1r−/−; Hip1+/null decalcified spinal cross-sections at 13 weeks of age. (D to F) Hematoxylin and eosin staining of Hip1r−/−; Hip1null/null decalcified spinal cross-sections at 13 weeks of age showing skeletal disorganization (arrows). Thoracic (A and D) and lumbar (B, C, E, and F) sections are shown. Note the abnormal asymmetric vertebral body with cartilage encroaching the bone marrow (arrows) and normal spinal cord (✽).

References

    1. Anonymous. 2004. Mouse genome database. Mouse Genome Informatics, The Jackson Laboratory, Bar Harbor, Maine. [Online.] http://www.informatics.jax.org.
    1. Chopra, V. S., M. Metzler, D. M. Rasper, A. E. Engqvist-Goldstein, R. Singaraja, L. Gan, K. M. Fichter, K. McCutcheon, D. Drubin, D. W. Nicholson, and M. R. Hayden. 2000. HIP12 is a non-proapoptotic member of a gene family including HIP1, an interacting protein with Huntingtin. Mamm. Genome 11: 1006-1015. - PubMed
    1. Dlugosz, A. A., A. B. Glick, T. Tennenbaum, W. C. Weinberg, and S. H. Yuspa. 1995. Isolation and utilization of epidermal keratinocytes for oncogene research. Methods Enzymol. 254: 3-20. - PubMed
    1. Engqvist-Goldstein, A. E., M. M. Kessels, V. S. Chopra, M. R. Hayden, and D. G. Drubin. 1999. An actin-binding protein of the Sla2/Huntingtin interacting protein 1 family is a novel component of clathrin-coated pits and vesicles. J. Cell Biol. 147: 1503-1518. - PMC - PubMed
    1. Engqvist-Goldstein, A. E., R. A. Warren, M. M. Kessels, J. H. Keen, J. Heuser, and D. G. Drubin. 2001. The actin-binding protein Hip1R associates with clathrin during early stages of endocytosis and promotes clathrin assembly in vitro. J. Cell Biol. 154: 1209-1223. - PMC - PubMed

Publication types

MeSH terms