Comparative Study
. 2004 May 11;43(18):5126-37.
doi: 10.1021/bi035212y.

Poliovirus RNA-dependent RNA polymerase (3Dpol): pre-steady-state kinetic analysis of ribonucleotide incorporation in the presence of Mg2+

Affiliations
Comparative Study

Poliovirus RNA-dependent RNA polymerase (3Dpol): pre-steady-state kinetic analysis of ribonucleotide incorporation in the presence of Mg2+

Jamie J Arnold et al. Biochemistry. .

Abstract

We have solved the complete kinetic mechanism for correct nucleotide incorporation catalyzed by the RNA-dependent RNA polymerase from poliovirus, 3D(pol). The phosphoryl-transfer step is flanked by two isomerization steps. The first conformational change may be related to reorientation of the triphosphate moiety of the bound nucleotide, and the second conformational change may be translocation of the enzyme into position for the next round of nucleotide incorporation. The observed rate constant for nucleotide incorporation by 3D(pol) (86 s(-1)) is dictated by the rate constants for both the first conformational change (300 s(-1)) and phosphoryl transfer (520 s(-1)). Changes in the stability of the "activated" ternary complex correlate best with changes in the observed rate constant for incorporation resulting from modification of the nucleotide. With the exception of UTP, the K(d) values for nucleotides are at least 10-fold lower than the cellular concentration of the corresponding nucleotide. Our data predict that transition mutations should occur at a frequency of 1/15000, transversion mutations should occur at a frequency of less than 1/150000, and incorporation of a 2'-deoxyribonucleotide with a correct base should occur at a frequency 1/7500. Together, these data support the conclusion that 3D(pol) is actually as faithful as an exonuclease-deficient, replicative DNA polymerase. We discuss the implications of this work on the development of RNA-dependent RNA polymerase inhibitors for use as antiviral agents.


Figures
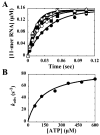
FIGURE 1
FIGURE 1
Determination of Kd,app and kpol for AMP incorporation into sym/sub. (A) 2 μM 3Dpol was incubated with 2 μM sym/sub (1 μM duplex) and rapidly mixed with either 60, 120, 240, 360, 480, or 600 μM ATP (final concentrations) as described under Experimental Procedures. The solid lines represent the kinetic simulation of the mechanism shown in Scheme 2 with the kinetic parameters shown in Table 2 for AMP incorporation into sym/sub by 3Dpol at ATP concentrations (final) of 60 (●), 120 (○), 240 (■), 360 (□), 480 (▲), or 600 (△) μM. (B) kobs as a function of ATP concentration obtained from the reactions described in (A). The solid line represents the fit of the data to a hyperbola with a Kd,app for ATP of 134 ±18 μM and a kpol of 86.7 ± 3.7 s-1.
FIGURE 2
FIGURE 2
Elemental effect on the pre-steady-state rate of AMP incorporation. 2 μM 3Dpol was incubated with 2 μM sym/sub (1 μM duplex) and rapidly mixed with either 500 μM ATP (●) or 500 μM ATPαS (○) (final concentration) as described under Experimental Procedures. The solid lines represent the fit of the data to a single exponential with a kobs for ATP of 66.7 ± 1.7 s-1 and a kobs for ATPαS of 17.6 ± 0.4 s-1.
FIGURE 3
FIGURE 3
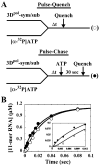
Intermediate identification by pulse-chase analysis. (A) Experimental design. 4 μM 3Dpol was incubated with 20 μM sym/sub (10 μM duplex) and rapidly mixed with 130 μM [α-32P]ATP (3.8 Ci/mmol) (final concentration) as described under Experimental Procedures. At the indicated times, reactions were either chased by addition of ATP to a final concentration of 20 mM or quenched by addition of HCl to a final concentration of 1 M. After addition of the chase solution, the reaction was allowed to proceed for an additional 30 s, at which time the reaction was quenched by addition of HCl to a final concentration of 1 M. Immediately after addition of HCl, the solution was neutralized by addition of 1 M KOH and 300 mM Tris (final concentration). (B) Kinetics of pulse-chase (●) and pulse-quench (○) from the reactions described in (A). The solid lines represent the kinetic simulation of the data fit to the mechanism shown in Scheme 2 with the kinetic parameters shown in Table 2. The simulated curve of the pulse-quench data predicts the rate of formation of all Rn+1-containing species; the simulated curve of the pulse-chase data predicts the rate of formation of *ERnNTP and all Rn+1-containing species.
FIGURE 4
FIGURE 4
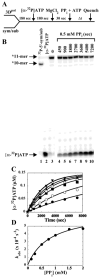
Single-turnover pyrophosphorolysis. (A) Experimental design. 2 μM 3Dpol was incubated with 2 μM sym/sub (1 μM duplex) for 180 s, at which point 0.30 μM [α-32P]ATP (3000 Ci/mmol) was added to the reaction. 180 s after addition of [α-32P]-ATP, supplemental MgCl2 was added to the reaction such that upon addition of PPi and ATP the final concentration of free MgCl2 was 5 mM. After addition of MgCl2, the reaction was initiated by addition of 100 μM ATP and either 0.125, 0.25, 0.5, 0.75, 1, 1.5, or 2.0 mM PPi (final concentrations). After mixing, reactant concentrations were reduced by 50%. At fixed times after addition of PPi and ATP the reaction was quenched by addition of EDTA to a final concentration of 250 mM. (B) Products from a reaction described in (A) at 0.5 mM PPi (final concentration) resolved by electrophoresis on a denaturing, highly cross-linked 25% polyacrylamide gel. 32P-5′-end-labeled sym/sub and [α-32P]ATP are indicated as a reference (lanes 1 and 2, respectively). (C) Kinetics of pyrophosphorolysis from the reactions described in (A) by monitoring the production of [α-32P]ATP at PPi concentrations (final) of 0.125 (●), 0.25 (○), 0.5 (■), 0.75 (□), 1.0 (▲), 1.5 (△), and 2.0 mM (▼). The solid lines represent the kinetic simulation of the mechanism shown in Scheme 2 with the kinetic parameters shown in Table 2. (D) kobs as a function of PPi concentration obtained from the reactions described in (C). The solid line represents the fit of the data to a hyperbola with a Kd,app for PPi of 0.81 ± 0.10 mM and a kpryo of (6.9 ± 0.4) × 10-4 s-1.
FIGURE 5
FIGURE 5
Pyrophosphate exchange. (A) Experimental design. 2 μM 3Dpol was incubated with 20 μM sym/sub (10 μM duplex) for 90 s to produce 3Dpol-sym/sub complexes (0.8 μM), at which point supplemental MgCl2 was added to the reaction such that upon addition of PPi and ATP the final concentration of free MgCl2 was 5 mM. After addition of MgCl2, the reaction was initiated by addition of 1000 μM ATP and either 0 or 2 mM [32P]PPi (0.26 Ci/mmol). After mixing, reactant concentrations were reduced by 50%. Reactions were quenched at the indicated times by addition of EDTA to a final concentration of 125 mM. (B) Products from the reactions described in (A) resolved by TLC. (C) Kinetics of pyrophosphate exchange by monitoring the production of [α-32P]ATP at 1 mM PPi (final concentration). The solid line represents the fit of the data to a line with a y-intercept of 0.014 ± 0.005 μM and a slope of (4.52 ± 0.17) × 10-4 μM s-1. (D) Experimental design. 2 μM 3Dpol was incubated with either 2 or 20 μM sym/sub (1 or 10 μM duplex) for 90 s to produce 3Dpol-sym/sub complexes (0.27 or 0.89 μM), at which point supplemental MgCl2 was added to the reaction such that upon addition of PPi and ATP the final concentration of free MgCl2 was 5 mM. After addition of MgCl2, the reaction was initiated by addition of 200 μM [γ-32P]ATP (10 Ci/mmol) and either 0 or 2 mM PPi. After mixing, reactant concentrations were reduced by 50%. Reactions were quenched at the indicated times by addition of EDTA to a final concentration of 125 mM. (E) Products from the reactions described in (D) resolved by TLC. (F) Kinetics of pyrophosphate exchange by monitoring the production of [32P]PPi at 0 (●) and 1 mM (○) PPi (solid line) for 1 μM sym/sub final and at 0 (■) and 1 mM (□) PPi (dashed line) for 10 μM sym/sub final. The solid line represents the fit of the data to a line with a y-intercept of 0.51 ± 0.02 μM and a slope of (5.9 ± 0.8) × 10-5 μM s-1 for 0 mM PPi (1 μM sym/sub final), a y-intercept of 0.51 ± 0.03 μM and a slope of (7.8 ± 0.1) × 10-4 μM s-1 for 1 mM PPi (1 μM sym/sub final), a y-intercept of 0.93 ± 0.04 μM and a slope of (1.1 ± 0.2) × 10-4 μM s-1 for 0 mM PPi (10 μM sym/sub final), and a y-intercept of 0.98 ± 0.09 μM and a slope of (1.1 ± 0.3) × 10-3 μM s-1 for 1 mM PPi (10 μM sym/sub final).
FIGURE 6
FIGURE 6
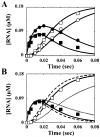
Evidence for a conformational change after chemistry. (A) 2 μM 3Dpol was incubated with 2 μM sym/sub (1 μM duplex) and rapidly mixed with 500 μM ATP and either 100 or 300 μM UTP (final concentrations). After mixing, reactant concentrations were reduced by 50%. Key: Kinetics of formation and disappearance of the 11-mer (●) and 12-mer (○) for 500 μM ATP and 100 μM UTP (final) and kinetics of formation and disappearance of the 11-mer (■) and 12-mer (□) for 500 μM ATP and 300 μM UTP (final). The solid lines represent the kinetic simulation of the data fit to a mechanism for two successive nucleotide incorporations with the first nucleotide incorporation described by the kinetic mechanism shown in Scheme 2 using the kinetic parameters in Table 2 and the second nucleotide incorporation described by the mechanism shown in Scheme 1 using the Kd,app and kpol values for UTP using sym/sub-UA shown in Table 1. (B) Kinetics of formation and disappearance of the 11-mer (■) and 12-mer (□) for the reaction described in (A) for 500 μM ATP and 300 μM UTP (final). The lines represent the kinetic simulation of the data fit to a mechanism for two successive nucleotide incorporations with the first nucleotide incorporation described by the kinetic mechanism shown in Scheme 2 using the kinetic parameters in Table 2 and the second nucleotide incorporation described by the mechanism shown in Scheme 1 using the Kd,app and kpol values for UTP using sym/sub-UA shown in Table 1, however with different values for k+4. The solid line is the fit of the data with a k+4 of 500 s-1, the longer dashed line is the fit of the data with a k+4 of 2000 s-1, and the smaller dashed line is the fit of the data with a k+4 of 100 s-1.
FIGURE 7
FIGURE 7
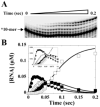
Processive synthesis of ribonucleotide incorporation into sym/sub. (A) 2 μM 3Dpol was incubated with 2 μM sym/sub (1 μM duplex) and rapidly mixed with 250 μM each NTP. (B) Kinetics of formation and disappearance of 11-mer (●), 12-mer (○), 13-mer (■), and 14-mer (□). The solid lines represent the kinetic simulation of the data fit to four sequential nucleotide incorporations with net rate constants for formation of 11-mer at 50 s-1, 12-mer at 50 s-1, 13-mer at 50 s-1, and 14-mer at 50 s-1.
FIGURE 8
FIGURE 8
Free energy profile for 3Dpol-catalyzed nucleotide incorporation. The free energy changes for nucleotide incorporation were calculated from the kinetic parameters shown in Table 2. The concentrations of the substrates and products used were 2000 μM ATP and 20 μM PPi. The free energy for each reaction step was calculated from ΔG = RT[ln(kT/h) - ln(kobs)], where R is 1.99 cal K-1 mol-1, T is 303 K, k is 3.30 × 10⁻²⁴ cal K-1, h is 1.58 × 10⁻³⁴ cal s, and kobs is the first-order rate constant. The free energy for each species was calculated from ΔG = RT[ln(kT/h) - ln(kobs,for)] - RT[ln(kT/h) - ln(kobs,rev)].
Scheme 1
Scheme 1
Minimal Kinetic Mechanism for 3Dpol-Catalyzed Nucleotide Incorporationa a Abbreviations: ERn, 3Dpol sym/sub complex; NTP, nucleotide; ERnNTP, ternary complex; ERn+1PPi, product complex.
Scheme 2
Scheme 2
Complete Kinetic Mechanism for 3Dpol-Catalyzed Nucleotide Incorporationa a Abbreviations: ERn, 3Dpol sym/sub complex; NTP, nucleotide; ERnNTP, ternary complex; *ERnNTP, activated elongation complex; *ERn+1PPi, activated product complex; ERn+1PPI, product complex; ERn+1, 3Dpol sym/sub product complex; PPi, pyrophosphate.

References

    1. Jonckheere H, Anne J, De Clercq E. The HIV-1 reverse transcription (RT) process as target for RT inhibitors. Med. Res. Rev. 2000;20:129–154. - PubMed
    1. Tarrago-Litvak L, Andreola ML, Nevinsky GA, Sarih-Cottin L, Litvak S. The reverse transcriptase of HIV-1: From enzymology to therapeutic intervention. FASEB J. 1994;8:497–503. - PubMed
    1. De Clercq E. HIV inhibitors targeted at the reverse transcriptase. AIDS Res. Hum. Retroviruses. 1992;8:119–134. - PubMed
    1. Furman PA, Painter GR, Anderson KS. An analysis of the catalytic cycle of HIV-1 reverse transcriptase: Opportunities for chemotherapeutic intervention based on enzyme inhibition. Curr. Pharm. Des. 2000;6:547–567. - PubMed
    1. Kati WM, Johnson KA, Jerva LF, Anderson KS. Mechanism and fidelity of HIV reverse transcriptase. J. Biol. Chem. 1992;267:25988–25997. - PubMed

Publication types

MeSH terms