Compositional gene landscapes in vertebrates
- PMID: 15123586
- PMCID: PMC479116
- DOI: 10.1101/gr.2246704
Compositional gene landscapes in vertebrates
Abstract
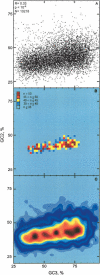
The existence of a well conserved linear relationship between GC levels of genes' second and third codon positions (GC2, GC3) prompted us to focus on the landscape, or joint distribution, spanned by these two variables. In human, well curated coding sequences now cover at least 15%-30% of the estimated total gene set. Our analysis of the landscape defined by this gene set revealed not only the well documented linear crest, but also the presence of several peaks and valleys along that crest, a property that was also indicated in two other warm-blooded vertebrates represented by large gene databases, that is, mouse and chicken. GC2 is the sum of eight amino acid frequencies, whereas GC3 is linearly related to the GC level of the chromosomal region containing the gene. The landscapes therefore portray relations between proteins and the DNA environments of the genes that encode them.
Figures


Similar articles
-
Diversity in isochore structure among cold-blooded vertebrates based on GC content of coding and non-coding sequences.Genetica. 2007 Mar;129(3):281-9. doi: 10.1007/s10709-006-0009-2. Epub 2006 Aug 1. Genetica. 2007. PMID: 16897446
-
Compositional compartmentalization and gene composition in the genome of vertebrates.J Mol Evol. 1987;26(3):198-204. doi: 10.1007/BF02099852. J Mol Evol. 1987. PMID: 3129567
-
Can GC content at third-codon positions be used as a proxy for isochore composition?Mol Biol Evol. 2009 Aug;26(8):1829-33. doi: 10.1093/molbev/msp100. Epub 2009 May 14. Mol Biol Evol. 2009. PMID: 19443854
-
The pig genome: compositional analysis and identification of the gene-richest regions in chromosomes and nuclei.Gene. 2004 Dec 22;343(2):245-51. doi: 10.1016/j.gene.2004.09.011. Gene. 2004. PMID: 15588579
-
The compositional transition between the genomes of cold- and warm-blooded vertebrates: codon frequencies in orthologous genes.Gene. 2000 Dec 30;261(1):71-83. doi: 10.1016/s0378-1119(00)00520-5. Gene. 2000. PMID: 11164039
Cited by
-
The "Genomic Code": DNA Pervasively Moulds Chromatin Structures Leaving no Room for "Junk".Life (Basel). 2021 Apr 13;11(4):342. doi: 10.3390/life11040342. Life (Basel). 2021. PMID: 33924668 Free PMC article. Review.
-
Universal Features for the Classification of Coding and Non-coding DNA Sequences.Bioinform Biol Insights. 2009 Jun 3;3:37-49. doi: 10.4137/bbi.s2236. Bioinform Biol Insights. 2009. PMID: 20140069 Free PMC article.
-
The neoselectionist theory of genome evolution.Proc Natl Acad Sci U S A. 2007 May 15;104(20):8385-90. doi: 10.1073/pnas.0701652104. Epub 2007 May 9. Proc Natl Acad Sci U S A. 2007. PMID: 17494746 Free PMC article.
-
Segmenting the Human Genome into Isochores.Evol Bioinform Online. 2015 Nov 25;11:253-61. doi: 10.4137/EBO.S27693. eCollection 2015. Evol Bioinform Online. 2015. PMID: 26640363 Free PMC article.
-
An isochore map of human chromosomes.Genome Res. 2006 Apr;16(4):536-41. doi: 10.1101/gr.4910606. Genome Res. 2006. PMID: 16597586 Free PMC article.
References
-
- Bernardi, G. 2000. The compositional evolution of vertebrate genomes. Gene 259: 31-43. - PubMed
-
- ———. 2001. Misunderstandings about isochores. Part I. Gene 276: 3-13. - PubMed
-
- Bernardi, G. and Bernardi, G. 1986. The human genome and its evolutionary context. Cold Spring Harb. Symp. Quant. Biol. 51: 479-487. - PubMed
-
- Bernardi, G., Olofsson, B., Filipski, J., Zerial, M., Salinas, J., Cuny, G., Meunier-Rotival, M., and Rodier, F. 1985. The mosaic genome of warm-blooded vertebrates. Science 228: 953-958. - PubMed
MeSH terms
Substances
LinkOut - more resources
Full Text Sources
Miscellaneous
