Comparative Study
. 2004 May;14(5):901-7.
doi: 10.1101/gr.1949704.

Two methods of whole-genome amplification enable accurate genotyping across a 2320-SNP linkage panel

Affiliations
Comparative Study

Two methods of whole-genome amplification enable accurate genotyping across a 2320-SNP linkage panel

David L Barker et al. Genome Res. 2004 May.

Abstract

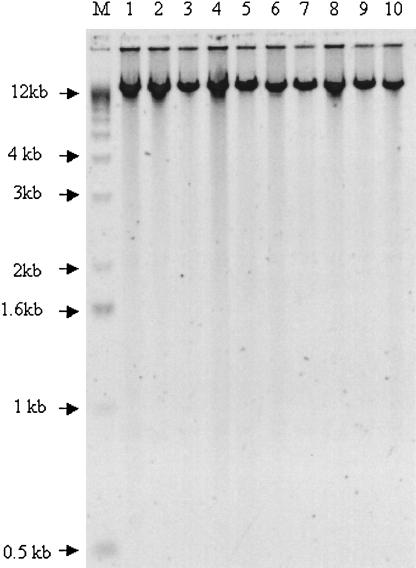
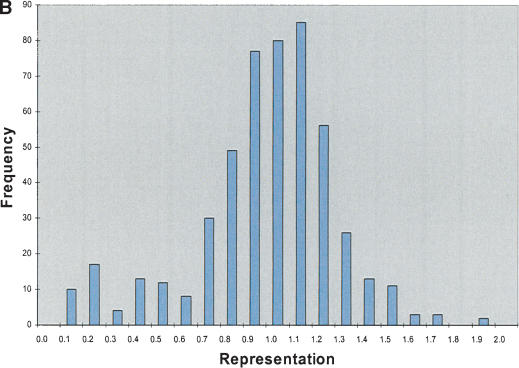
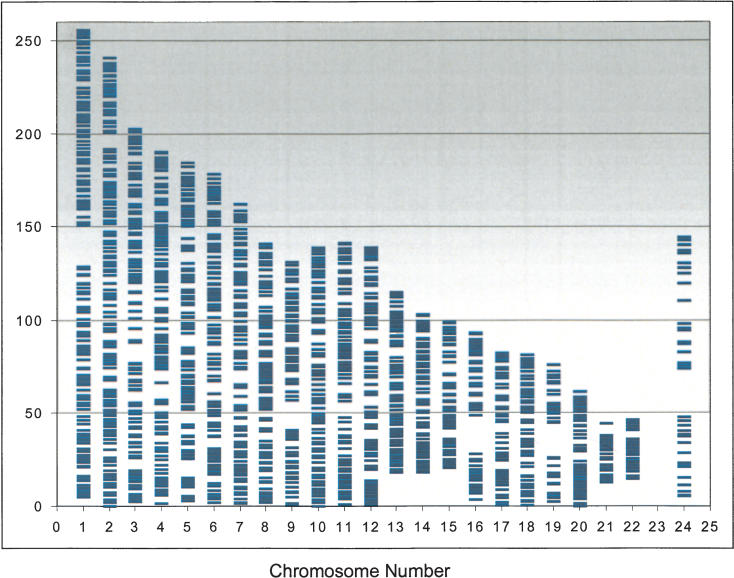
Comprehensive genome scans involving many thousands of SNP assays will require significant amounts of genomic DNA from each sample. We report two successful methods for amplifying whole-genomic DNA prior to SNP analysis, multiple displacement amplification, and OmniPlex technology. We determined the coverage of amplification by analyzing a SNP linkage marker set that contained 2320 SNP markers spread across the genome at an average distance of 2.5 cM. We observed a concordance of >99.8% in genotyping results from genomic DNA and amplified DNA, strongly indicating the ability of both methods used to amplify genomic DNA in a highly representative manner. Furthermore, we were able to achieve a SNP call rate of >98% in both genomic and amplified DNA. The combination of whole-genome amplification and comprehensive SNP linkage analysis offers new opportunities for genetic analysis in clinical trials, disease association studies, and archiving of DNA samples.


Figures

Figure 1
Figure 1
Amplification products after MDA amplification. All 10 amplified genomic DNA samples were loaded onto an agarose gel, separated by electrophoresis, and imaged after staining with SYBR Green (Molecular Probes).
Figure 2
Figure 2
STS analysis of OmniPlex amplified DNA. (A) Amplification curves for 1 well of each of the 10 samples of DNA. Fluorescence intensities after each cycle of PCR in the Bio-Rad ICycler were normalized to the maximum intensity. Duplicate samples share the same symbol. (B) Representative histogram of the representation of 103 STS sites within all 10 of the amplified DNA samples. The value for each STS was divided by the average STS value for that sample and the representation was subsequently calculated by taking the average values for the duplicate samples. Greater than 90% of sites were within a factor of 2 of the mean amplification. The total number of comparisons was 500. (C) Histogram of ratios of each 103 STS to each other for the five different DNA sources. Duplicate samples were averaged and the values were normalized to a copy number of 2 by dividing by the average ratio for each STS pair over the 10 samples and multiplying by two. Total number of ratios is 20,930 and 95.2% of the ratios were between 1.5 and 2.5 copies.
Figure 2
Figure 2
STS analysis of OmniPlex amplified DNA. (A) Amplification curves for 1 well of each of the 10 samples of DNA. Fluorescence intensities after each cycle of PCR in the Bio-Rad ICycler were normalized to the maximum intensity. Duplicate samples share the same symbol. (B) Representative histogram of the representation of 103 STS sites within all 10 of the amplified DNA samples. The value for each STS was divided by the average STS value for that sample and the representation was subsequently calculated by taking the average values for the duplicate samples. Greater than 90% of sites were within a factor of 2 of the mean amplification. The total number of comparisons was 500. (C) Histogram of ratios of each 103 STS to each other for the five different DNA sources. Duplicate samples were averaged and the values were normalized to a copy number of 2 by dividing by the average ratio for each STS pair over the 10 samples and multiplying by two. Total number of ratios is 20,930 and 95.2% of the ratios were between 1.5 and 2.5 copies.
Figure 3
Figure 3
Graphical representation of SNP distribution over human chromosomes of the SNP linkage panel used in this study. A total of 2320 SNP markers are spread across the genome, excepting the Y-chromosome, at an average distance of 2.5 cM.

References

    1. Ahn, S.J., Costa, J., and Emanuel, J.R. 1996. PicoGreen quantitation of DNA: Effective evaluation of samples pre- or post-PCR. Nucleic Acids Res. 24: 2623-2625. - PMC - PubMed
    1. Barker, D.L., Theriault, G., Che, D., Dickinson, T., Shen, R., and Kain, R. 2003. Self-assembled random arrays: High-performance imaging and genomics applications on a high-density microarray platform. Proc. SPIE 4966: 1-11.
    1. Buckley, P.G., Mantripragada, K.K., Benetkiewicz, M., Tapia-Paez, I., Diaz De Stahl, T., Rosenquist, M., Ali, H., Jarbo, C., De Bustos, C., Hirvela, C., et al. 2002. A full-coverage, high-resolution human chromosome 22 genomic microarray for clinical and research applications. Hum. Mol. Genet. 11: 3221-3229. - PubMed
    1. Cheung, V.G. and Nelson, S.F. 1996. Whole genome amplification using a degenerate oligonucleotide primer allows hundreds of genotypes to be performed on less than one nanogram of genomic DNA. Proc. Natl. Acad. Sci. 93: 14676-14679. - PMC - PubMed
    1. Dean, F.B., Nelson, J.R., Giesler, T.L., and Lasken, R.S. 2001. Rapid amplification of plasmid and phage DNA using Phi 29 DNA polymerase and multiply-primed rolling circle amplification. Genome Res. 11: 1095-1099. - PMC - PubMed

WEB SITE REFERENCES

    1. www.rubicongenomics.com; Contains information on Omniplex DNA Amplification Kits.

Publication types

MeSH terms