. 2004 Jul 9;279(28):29341-50.
doi: 10.1074/jbc.M404167200. Epub 2004 May 3.

Early painful diabetic neuropathy is associated with differential changes in tetrodotoxin-sensitive and -resistant sodium channels in dorsal root ganglion neurons in the rat

Affiliations

Early painful diabetic neuropathy is associated with differential changes in tetrodotoxin-sensitive and -resistant sodium channels in dorsal root ganglion neurons in the rat

Shuangsong Hong et al. J Biol Chem. .

Abstract

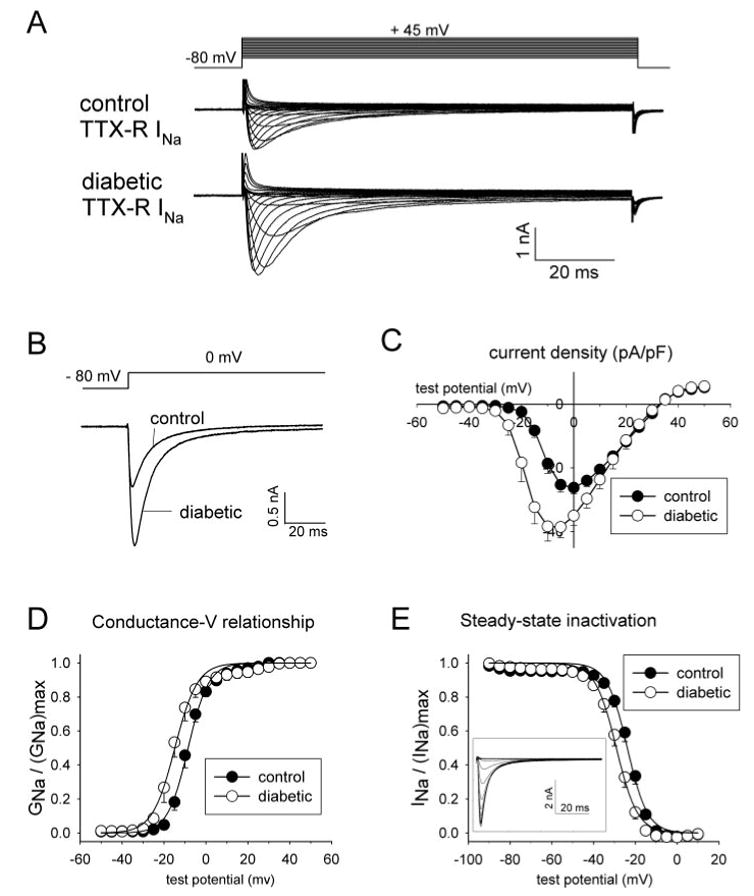
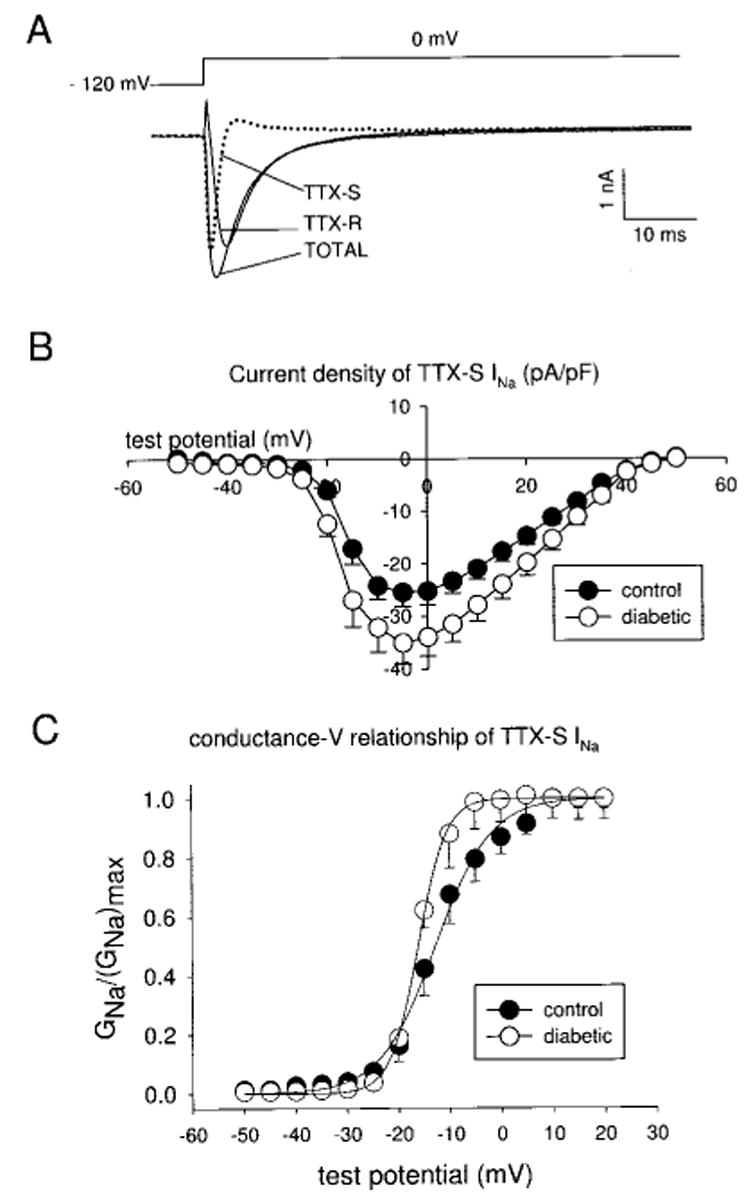
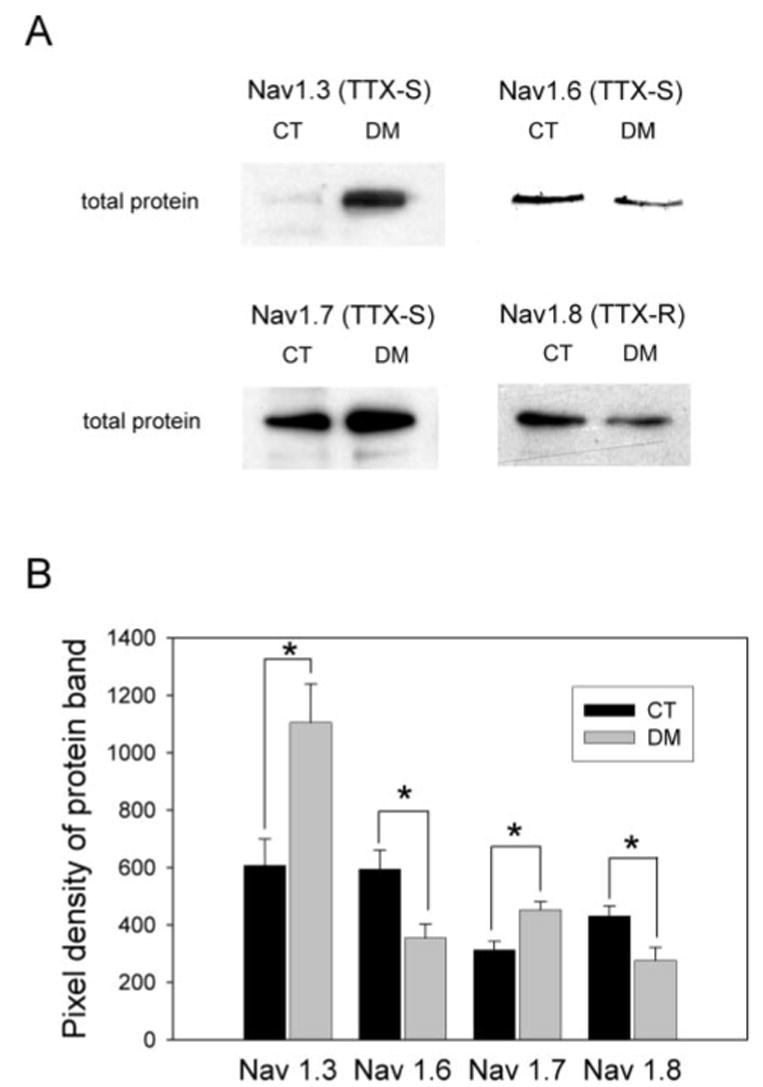
Diabetic neuropathy is a common form of peripheral neuropathy, yet the mechanisms responsible for pain in this disease are poorly understood. Alterations in the expression and function of voltage-gated tetrodotoxin-resistant (TTX-R) sodium channels have been implicated in animal models of neuropathic pain, including models of diabetic neuropathy. We investigated the expression and function of TTX-sensitive (TTX-S) and TTX-R sodium channels in dorsal root ganglion (DRG) neurons and the responses to thermal hyperalgesia and mechanical allodynia in streptozotocin-treated rats between 4-8 weeks after onset of diabetes. Diabetic rats demonstrated a significant reduction in the threshold for escape from innocuous mechanical pressure (allodynia) and a reduction in the latency to withdrawal from a noxious thermal stimulus (hyperalgesia). Both TTX-S and TTX-R sodium currents increased significantly in small DRG neurons isolated from diabetic rats. The voltage-dependent activation and steady-state inactivation curves for these currents were shifted negatively. TTX-S currents induced by fast or slow voltage ramps increased markedly in neurons from diabetic rats. Immunoblots and immunofluorescence staining demonstrated significant increases in the expression of Na(v)1.3 (TTX-S) and Na(v) 1.7 (TTX-S) and decreases in the expression of Na(v) 1.6 (TTX-S) and Na(v)1.8 (TTX-R) in diabetic rats. The level of serine/threonine phosphorylation of Na(v) 1.6 and In Na(v)1.8 increased in response to diabetes. addition, increased tyrosine phosphorylation of Na(v)1.6 and Na(v)1.7 was observed in DRGs from diabetic rats. These results suggest that both TTX-S and TTX-R sodium channels play important roles and that differential phosphorylation of sodium channels involving both serine/threonine and tyrosine sites contributes to painful diabetic neuropathy.


Figures

Fig. 1
Fig. 1. Line graphs show the development of mechanical allodynia (A) and thermal hyperalgesia (B) following the onset of diabetes in STZ-treated rats as compared with saline treated controls
Note that significant differences in pain-related behaviors in response to both mechanical (Von Frey test) and thermal (Hargreaves test) stimuli are not significant until at least 4 weeks after the administration of STZ, a time when peripheral signs of neuropathy are clearly evident. Data shown are mean values ± S.E. of 6 rats tested each group. The significance (p < 0.05) are indicated as asterisks (*).
Fig. 2
Fig. 2. Changes in amplitude and properties of TTX-R INa in small-sized DRG neurons from diabetic rats
A, typical traces of TTX-R INa conducted in voltage-clamp mode in control (top) and diabetic (bottom) rats. Cells were voltage-clamped at −80 mV, and currents were elicited by stepping voltage from −50 mV in the presence of 200 nM TTX. B, single traces of TTX-R INa elicited by depolarizing cells to 0 mV from the holding potential in neurons from control and diabetic rats. C, line graph showing the current-voltage relationship using current density as the indicator for INa in DRG neurons from control and diabetic rats. This I-V curve shifted leftward in DRG cells from diabetic animals. D, normalized Na+ conductance-voltage curves obtained after 6 min of cell rapture. Conductance was calculated according to the equation G = I/(V − Vres), where V is the test potential and Vres is the reversal potential of sodium. Data are fit with a single Boltzmann equation: GNa/(GNa)max = 1/(1 + exp(E50E)/k), where E50 is the potential(E) at which G is half of Gmax. E, normalized current-voltage curves of steady-state inactivation. Inlet shows typical traces of INa recorded after a long pre-pulse to −100 mV (1000 ms) followed by stepping voltage from −90 mV to +10 mV in 5 mV increments. Data are fit with a single Boltzmann equation. Error bars indicate S.E. ○, control; ●, diabetic.
Fig. 3
Fig. 3. Enhanced total INa in small-size DRG neurons from diabetic rats
A, increased current density of total INa in small-size DRGs from diabetic rats compared with the control. The difference in the maximum of peak current density was significant between control and diabetic rats (p < 0.05). B, original action potential traces recorded in current-clamp mode without adjusting the membrane potential after cell rupture. The average amplitude of action potential was significantly larger in diabetic (130.3 ± 1.3 mV) than that in control (115.3 ± 0.9 mV) neurons (p < 0.05). Error bars indicate S.E.
Fig. 4
Fig. 4. Increased amplitude and altered properties of TTX-S INa in small-sized DRG neurons from diabetic rats
A, typical recording traces showing the isolation of TTX-S sodium current (dotted trace) from total sodium current and TTX-R current. Cells were clamped at −80 mV and depolarized to 0 mV after a pre-pulse to −120 mV for 50 ms to obtain total INa as indicated. TTX of 200 nM was delivered by puffer on top of the cell, and TTX-R current trace was recorded. TTX-S current trace was obtained by subtraction of TTX-R INa trace from total INa trace. B, the maximum current density of TTX-S INa enhanced about 40% in DRG neurons from diabetic rats when compared with the control. The I-V curve shifted leftward around 5 mV in DRG neurons of diabetic rats. C, conductance-voltage relationship of TTX-S INa in DRG neurons from control and diabetic rats. The half-activation voltage was −16.1 ± 0.1 mV for TTX-S INa in diabetics and −12.8 ± 0.4 mV in controls, respectively. The difference was significant (p < 0.05). The slope factor was also significant larger in neurons from diabetic rats (5.4 ± 0.3) than that from control rats (2.7 ± 0.1). Error bars indicate S.E.
Fig. 5
Fig. 5. Comparison of ramp currents in small-sized DRG neurons from control and diabetic rats
A, slow ramp currents elicited in DRG neurons by 695 ms voltage ramp extending from −120 to +40 mV (~0.23 mV/ms) from control and diabetic rats. B, fast ramp current traces examined by 69.5-ms voltage ramp from −120 to +40 mV (~2.3 mV/ms) in DRG neurons from control and diabetic rats. C, bar graph depicting the ramp current density (estimated by dividing the peak currents by the cell capacitance) evoked by fast and slow voltage ramps. Both current densities of fast and slow ramps were significantly larger in diabetic rats than controls (n = 13). Error bars indicate S.E., and the * indicates p < 0.05. D, original traces of resurgent current in DRG neurons from control and diabetic rats. The resurgent current was examined by a high depolarization to +30 mV followed by hyperpolarizing to −40 mV. The large DRG neuron (cell capacitance = 106) shows a typical slow inactivating current when hyperpolarized to −40 mV after a deep depolarization.
Fig. 6
Fig. 6. Western blot analysis of sodium channel α-subunits in DRG extracts from control and diabetic rats
A, expression of the α-subunits of sodium channels shown by Western blot using crude DRG membrane homogenates and polyclonal antibodies directly against the TTX-S (Nav1.3, Nav1.6, Nav1.7) and TTX-R (Nav1.8) α-subunits of sodium channels. These antibodies labeled predominantly a high molecular mass protein (>200 kDa). The transblots were representatives of 4–5 independent analyses. B, histogram depicting relative intensities of Western blot analysis corresponding to the sodium channel α-subunits. The protein expression of Nav1.3 and Nav1.7 were found to be significantly increased (p < 0.05, Student’s t test) in diabetic rats compared with controls (n = 4, each group), whereas the total protein of Nav1.6 (TTX-S) and Nav1.8 (TTX-R) decreased significantly in DRG neurons of diabetic rats compared with the control (p < 0.05, n = 5). CT, control; DM, diabetic. Error bars indicate S.E., and the * indicates p < 0.05.
Fig. 7
Fig. 7. Double immunofluoresence staining of DRG neurons with C-type fiber marker peripherin (green) and sodium channel (red) antibodies
The neurons of double immunoreactivity positive are shown in yellow. Left panel, control; right panel, diabetic. A, decreased expression of TTX-S Nav1.6 in DRG neurons from diabetic rats (right panel) compared with the control (left panel). B, increased protein expression TTX-S Nav1.7 was detected in DRG neurons from diabetic (right panel) rats compared with the control (left panel). Both the percentage of and the percentage of Nav1.7-positive neurons double positive for Nav1.7 and peripherin were increased significantly for DRGs from diabetic rats (p < 0.05). C, protein expression of TTX-R Nav1.8 decreased in DRG neurons from diabetic rats. The percentage of DRG neurons positive for both peripherin (green) and Nav1.8 (red) decreased in DRG neurons from diabetic rats. Scale bar, 50 μm.
Fig. 8
Fig. 8. Phosphorylation states of sodium channels in DRG neurons from control and diabetic rats
A, increased phosphorylation of Nav1.8 in serine residue (p-Ser) and threonine residue (p-Thr) in diabetic rats. Crude DRG homogenates were used for immunoprecipitation followed by Western blot analysis. A high molecular mass band of protein (>200 kDa) was labeled in immunoblots (left panel), and the average of pixel intensity corresponding to the labeled band was shown in the bar graph (right panel). B, increased phosphorylation of Nav1.6 in serine, threonine, and tyrosine (p-Tyr) residues in diabetic rats. C, increased phosphorylation of Nav1.6 in serine, threonine, and tyrosine residues in diabetic rats. CT, control; DM, diabetic.

References

    1. Spruce MC, Potter J, Coppini DV. Diabet Med. 2003;20:88–98. - PubMed
    1. Calcutt NA, Jorge MC, Yaksh TL, Chaplan SR. Pain. 1996;68:293–299. - PubMed
    1. Fox A, Eastwood C, Gentry C, Manning D, Urban L. Pain. 1999;81:307–316. - PubMed
    1. Malcangio M, Tomlinson DR. Pain. 1998;76:151–157. - PubMed
    1. Stevens MJ, Dananberg J, Feldman EL, Lattimer SA, Kamijo M, Thomas TP, Shindo H, Sima AAF, Greene DA. J Clin Investig. 1994;94:853–859. - PMC - PubMed

Publication types

MeSH terms