. 2004 May 3;199(9):1213-21.
doi: 10.1084/jem.20031462.

Natural killer T cells infiltrate neuroblastomas expressing the chemokine CCL2

Affiliations

Natural killer T cells infiltrate neuroblastomas expressing the chemokine CCL2

Leonid S Metelitsa et al. J Exp Med. .

Abstract

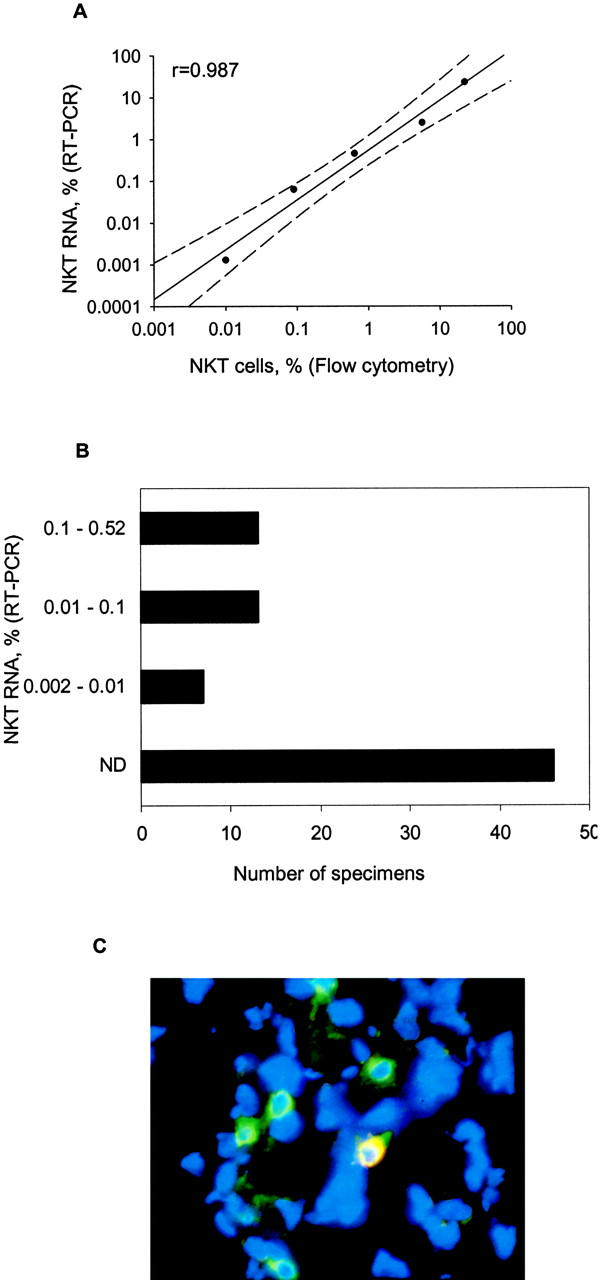
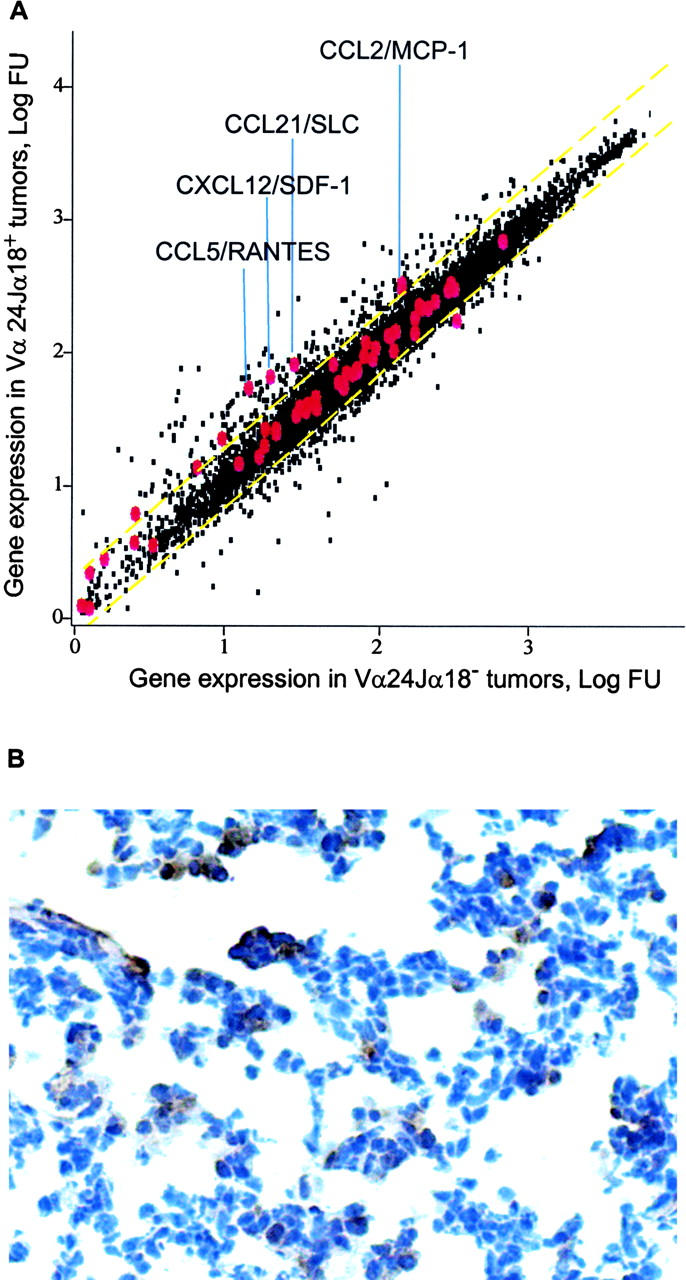
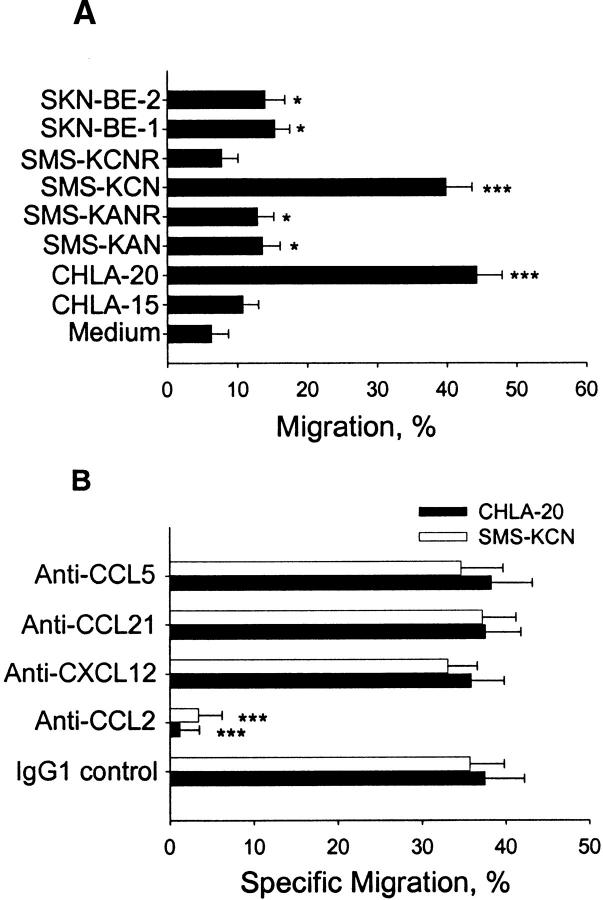
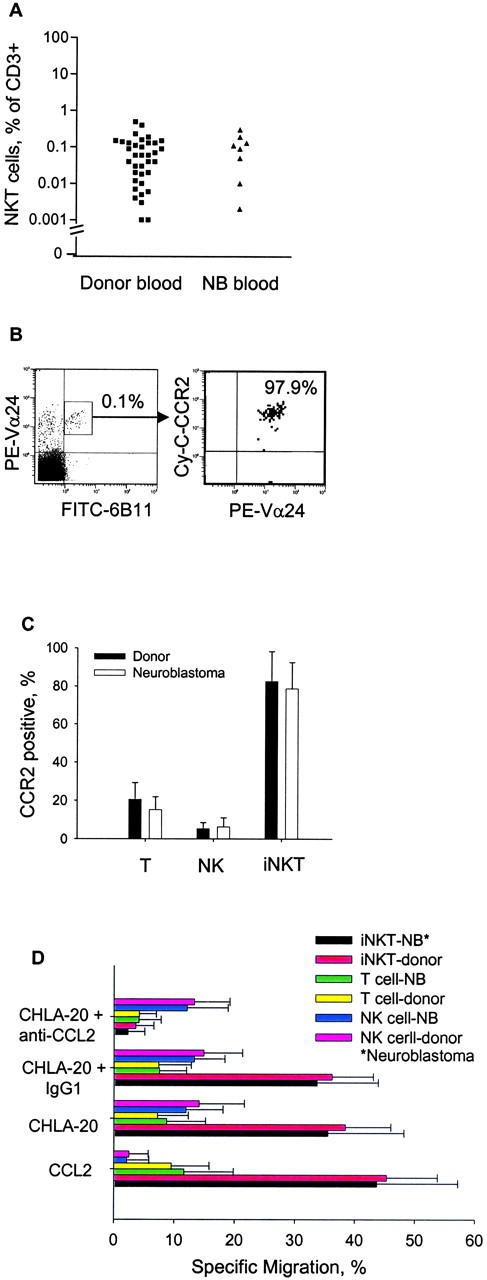
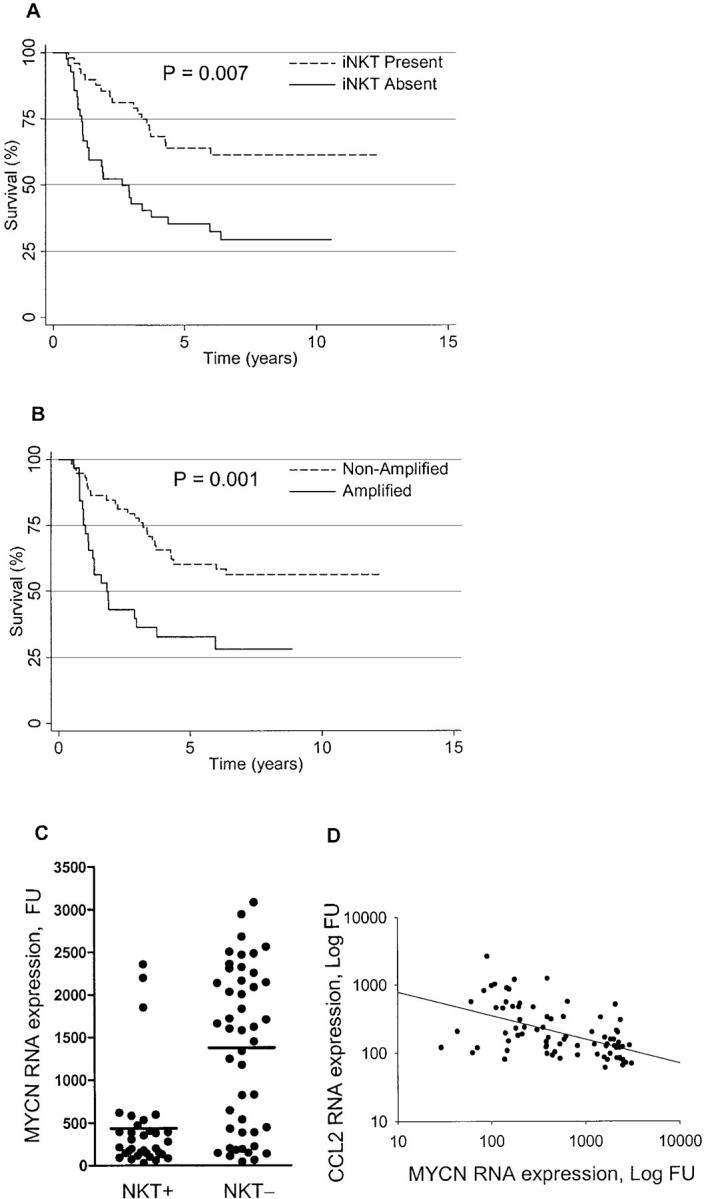
CD1d-restricted Valpha24-Jalpha18-invariant natural killer T cells (iNKTs) are potentially important in tumor immunity. However, little is known about their localization to tumors. We analyzed 98 untreated primary neuroblastomas from patients with metastatic disease (stage 4) for tumor-infiltrating iNKTs using TaqMan((R)) reverse transcription polymerase chain reaction and immunofluorescent microscopy. 52 tumors (53%) contained iNKTs, and oligonucleotide microarray analysis of the iNKT(+) and iNKT(-) tumors revealed that the former expressed higher levels of CCL2/MCP-1, CXCL12/SDF-1, CCL5/RANTES, and CCL21/SLC. Eight tested neuroblastoma cell lines secreted a range of CCL2 (0-21.6 ng/ml), little CXCL12 (</=0.1 ng/ml), and no detectable CCL5 or CCL21. CCR2, the receptor for CCL2, was more frequently expressed by iNKT compared with natural killer and T cells from blood (P < 0.001). Supernatants of neuroblastoma cell lines that produced CCL2 induced in vitro migration of iNKTs from blood of patients and normal adults; this was abrogated by an anti-CCL2 monoclonal antibody. CCL2 expression by tumors was found to inversely correlate with MYCN proto-oncogene amplification and expression (r = 0.5, P < 0.001), and MYCN-high/CCL2-low expression accurately predicted the absence of iNKTs (P < 0.001). In summary, iNKTs migrate toward neuroblastoma cells in a CCL2-dependent manner, preferentially infiltrating MYCN nonamplified tumors that express CCL2.


Figures

Figure 1.
Figure 1.
Detection and enumeration of tumor-infiltrating iNKTs. (A) iNKT cells (>99% pure) were serially diluted with neuroblastoma cells (LA-N-1 cell line) from 1:5 to 1:50,000, a iNKT/neuroblastoma cell ratio. RT-PCR for Vα24-Jα18 RNA and flow cytometry for iNKT TCR antigens were performed using cells from the same preparations. iNKT RNA percentage (y axis) is calculated as iNKT RNA ng/500 ng (total sample) × 100 and plotted against iNKT cell frequency detected by flow cytometry (x axis). Solid line is a linear regression, and dashed lines mark 95% confidence interval, P < 0.0001. (B) iNKT cell frequency in neuroblastoma tumors (n = 98) was calculated from detected iNKT RNA amount per 500 ng total sample RNA using the standard curve shown in A. (C) Frozen 6-μm sections were stained with Alexa Fluor® 488 anti-CD3 289-13801 (green), Cy-3 anti–Vα24-Jα18 6B11 (red) mAbs, and DAPI (blue). Digital image of microscopic field of tumor tissue (magnification, 64) is one representative from five analyzed iNKT+ tumors (four to six fields per tumor) with green-circled T cells and yellow (green + red)-circled iNKT among blue nucleated cells.
Figure 2.
Figure 2.
Chemokine expression in primary untreated neuroblastomas. (A) Expression profiles were generated from 79 untreated stage 4 neuroblastomas from patients using Affymetrix U95Av2 oligonucleotide microarrays. All genes (black) are plotted according to their average level of expression in tumors with undetectable (x axis) versus detectable (y axis) Vα24-Jα18 RNA (iNKT TCR). Gene probe sets for 43 chemokines are enlarged and labeled in red. Yellow dashed lines mark 95% confident interval. Names of chemokine genes that positively correlate with iNKT RNA expression are shown. (B) A tumor that expressed CCL2 mRNA was immunostained with goat anti–human CCL2 followed by the Cell and Tissue Staining Kit (R&D Systems). Tumor cells expressing CCL2 have brown cytoplasm.
Figure 3.
Figure 3.
iNKT cell migration to neuroblastoma cell line supernatants. (A) Medium alone or supernatants from neuroblastoma cell lines were used to assess TEM of an iNKT cell line. Percentage of migrating cells is indicated on the x axis. (B) Supernatants from neuroblastoma cell lines mixed with 10 μg/ml of neutralizing mAbs against indicated chemokines, or mouse IgG1 isotype control mAbs were tested for chemotactic activity using the same iNKT cell line and the TEM assay. Specific migration (x axis) is shown as net migration after subtraction of migration to medium alone. Results are mean ± SD from duplicates of four experiments.
Figure 4.
Figure 4.
CCR2 expression and migratory response of blood iNKTs from neuroblastoma patients. (A) iNKT cell frequency in blood T cells of normal donors (n = 36) and neuroblastoma (NB) patients (n = 8) was determined by three-color flow cytometry. (B) Representative flow cytometry diagrams demonstrating iNKT frequency in patient PBLs (left) and CCR2 expression in this iNKT subset (right). (C) Mean ± SD of CCR2 expression in indicated lymphocyte subpopulations from normal adults (n = 10) and neuroblastoma patients (n = 6). (D) TEM of monocyte-depleted peripheral blood lymphocytes from neuroblastoma patients (n = 4) and normal adults (n = 4) was evaluated with indicated conditions. Results are mean ± SD from duplicates of four experiments.
Figure 5.
Figure 5.
Patient survival, iNKT infiltration, MYCN amplification/expression, and CCL2 expression. (A) Survival for 98 patients whose tumors did or did not have iNKT infiltration (P = 0.007). (B) Survival for 98 patients whose tumors did or did not have MYCN amplification (P = 0.001). (C) MYCN expression and iNKT infiltration in primary neuroblastomas. MYCN RNA expression (y axis) was quantified by Affymetrix U95Av2 oligonucleotide microarrays and Vα24-Jα18 RNA was detected by Taqman RT-PCR in 79 untreated neuroblastomas. Tumors with detectable (NKT+) and undetectable (NKT). iNKTs expressed 434.6 ± 100.0 (n = 33) and 1,378 ± 139.5 (n = 46) MYCN FU, respectively (Student's t test, P < 0.001). (D) Correlation between MYCN and CCL2 expression. MYCN (x axis) and CCL2 (y axis) RNA were quantified by Affymetrix U95Av2 oligonucleotide microarrays in 79 untreated tumors. Regression line demonstrates an inverse correlation between MYCN and CCL2 (r = 0.5, P < 0.001, Spearman correlation analysis).

Similar articles

Cited by

References

    1. Bendelac, A., M.N. Rivera, S.H. Park, and J.H. Roark. 1997. Mouse CD1-specific NK1 T cells: development, specificity, and function. Annu. Rev. Immunol. 15:535–562. - PubMed
    1. Godfrey, D.I., K.J. Hammond, L.D. Poulton, M.J. Smyth, and A.G. Baxter. 2000. NKT cells: facts, functions and fallacies. Immunol. Today. 21:573–583. - PubMed
    1. Joyce, S. 2001. CD1d and natural T cells: how their properties jump-start the immune system. Cell. Mol. Life Sci. 58:442–469. - PMC - PubMed
    1. Smyth, M.J., N.Y. Crowe, Y. Hayakawa, K. Takeda, H. Yagita, and D.I. Godfrey. 2002. NKT cells - conductors of tumor immunity? Curr. Opin. Immunol. 14:165–171. - PubMed
    1. Brutkiewicz, R.R., and V. Sriram. 2002. Natural killer T (NKT) cells and their role in antitumor immunity. Crit. Rev. Oncol. Hematol. 41:287–298. - PubMed

Publication types

MeSH terms