. 2004 May 3;199(9):1265-75.
doi: 10.1084/jem.20032177.

A skin-selective homing mechanism for human immune surveillance T cells

Affiliations

A skin-selective homing mechanism for human immune surveillance T cells

Patrick Schaerli et al. J Exp Med. .

Abstract

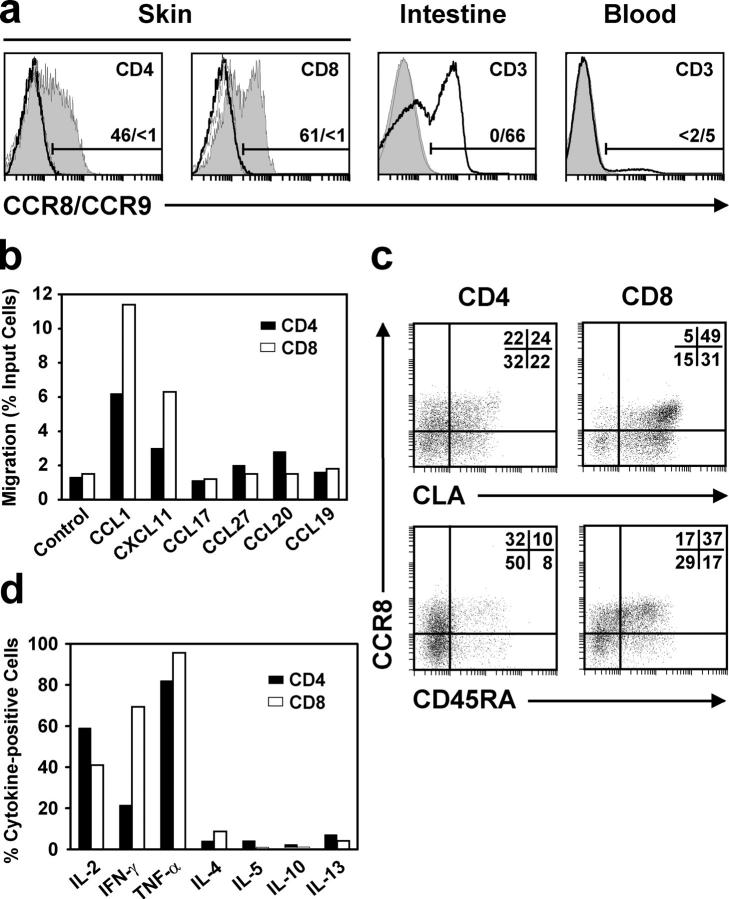
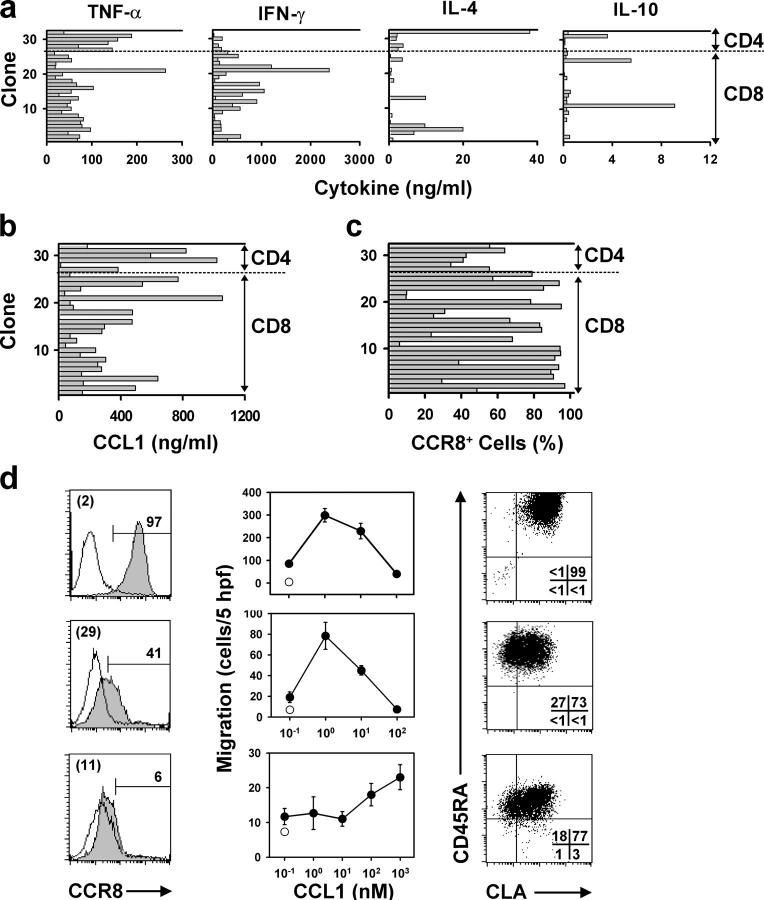
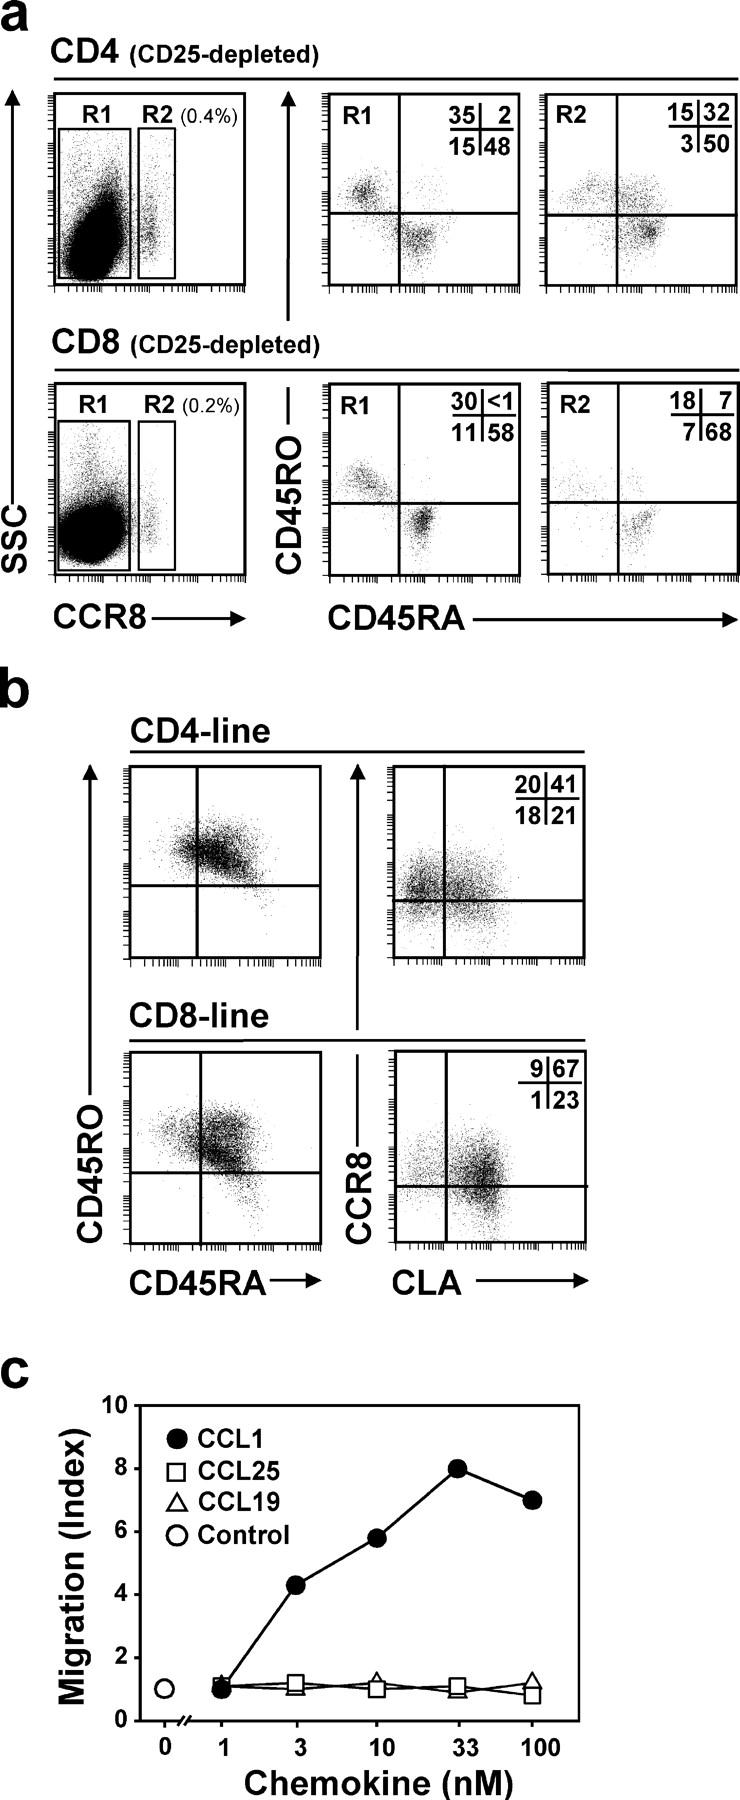
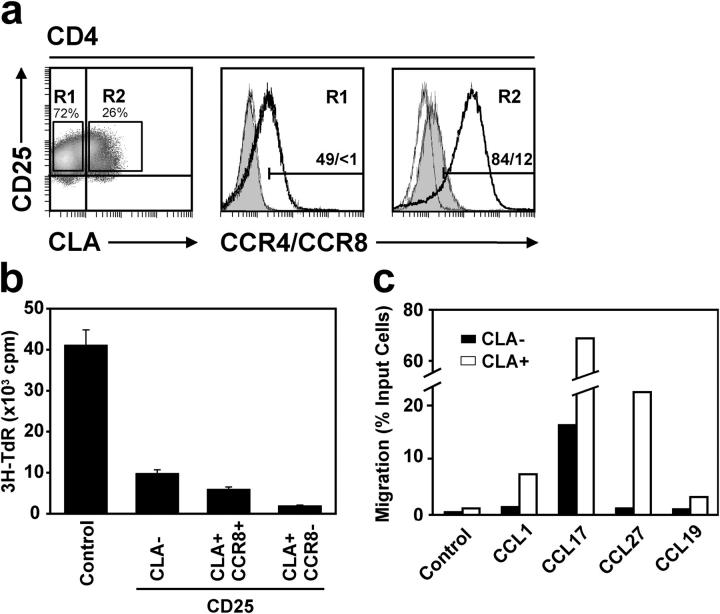
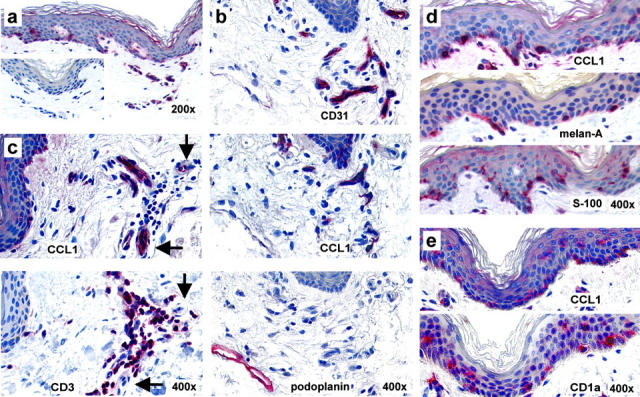
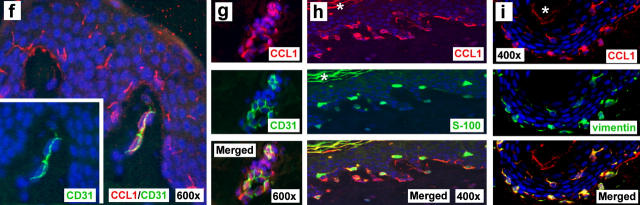
Effective immune surveillance is essential for maintaining protection and homeostasis of peripheral tissues. However, mechanisms controlling memory T cell migration to peripheral tissues such as the skin are poorly understood. Here, we show that the majority of human T cells in healthy skin express the chemokine receptor CCR8 and respond to its selective ligand I-309/CCL1. These CCR8(+) T cells are absent in small intestine and colon tissue, and are extremely rare in peripheral blood, suggesting healthy skin as their physiological target site. Cutaneous CCR8(+) T cells are preactivated and secrete proinflammatory cytokines such as tumor necrosis factor-alpha and interferon-gamma, but lack markers of cytolytic T cells. Secretion of interleukin (IL)-4, IL-10, and transforming growth factor-beta was low to undetectable, arguing against a strict association of CCR8 expression with either T helper cell 2 or regulatory T cell subsets. Potential precursors of skin surveillance T cells in peripheral blood may correspond to the minor subset of CCR8(+)CD25(-) T cells. Importantly, CCL1 is constitutively expressed at strategic cutaneous locations, including dermal microvessels and epidermal antigen-presenting cells. For the first time, these findings define a chemokine system for homeostatic T cell traffic in normal human skin.


Figures

Figure 1.
Figure 1.
CCR8+ T cells predominate in normal human skin. Analyses were performed with freshly isolated cells. (a) Flow cytometric detection of CCR8 (gray histograms) and CCR9 (bold line) in T cells isolated from human skin, lamina propria of small intestine, and peripheral blood. Peptide-blocked control for CCR8 staining is shown as a thin line. CD4, CD8, and CD3 denote the respective populations analyzed within the αβTCR+ cell gate, and the numbers indicate percentages of CCR8- and CCR9-positive cells, respectively. Data for skin and intestinal cells are representative for nine and three donors, respectively. (b) Chemotactic migration of skin T cells, gated on CD4+ cells (black bars) and CD8+ (white bars), in response to chemokines as indicated. Values represent the percentage of migrated cells as a proportion of input cells, and control denotes the level of migration in the absence of chemokines. (c) Expression of CLA and CD45RA on CCR8+ skin T cells. Gates were set for CD4+αβTCR+ cells (CD4) and CD8+αβTCR+ cells (CD8), and the numbers refer to the percentage of cells within each quadrant. (d) Production of various cytokines by CD4+ (black bars) or CD8+ (white bars) CCR8+αβTCR+ skin T cells. Intracellular accumulation of cytokines in response to PMA/ionomycin was measured by flow cytometry and is expressed as percent cytokine-positive cells. Chemotaxis and cytokine production data are representative of four independent experiments.
Figure 2.
Figure 2.
Analysis of T cell clones derived from skin CCR8+ T cells. Sorted CCR8+ T cells isolated from normal skin were cloned under nonpolarizing conditions. (a) For cytokine and (b) CCL1 secretion analysis, 6 CD4+ and 26 CD8+ T cell clones were stimulated with PMA/ionomycin for 24 h, and cell-free supernatants were tested in ELISA. (c) Expression of CCR8 by T cell clones, as determined by flow cytometry. Percent (%) CCR8+ refers to the fraction of CCR8-positive cells present within individual clones. (d) Detailed analysis of three clones representing high, intermediate, and low level expression of CCR8. Cells stained with anti-CCR8 antibodies (left, shaded histogram) or peptide-blocked anti-CCR8 (unshaded histogram). Numbers in parentheses indicate the clone number, whereas numbers above the gate lines refer to the percentage of cells positive for CCR8. The corresponding center panels show chemotactic responses of the same clones toward CCL1, expressed as the number of migrated cells counted (mean of triplicate wells ± SEM) in five high-power fields. Background migration in the absence of chemokine is indicated by open circles. The expression of CLA versus CD45RA, with the percentage of cells positive within each quadrant indicated (right).
Figure 3.
Figure 3.
Expression of CCR8 on a minor subset of CD25 peripheral blood T cells. (a) Characterization of CCR8 expression on freshly isolated, CD25-depleted CD4+ (top) or CD8+ (bottom) T cells. (left) Some dot plots demonstrate staining for CCR8 versus side scatter, whereas (right) others demonstrate expression of CD45RO and CD45RA on cells gated for absence (R1) or presence (R2) of CCR8 expression. (b) Characterization of CCR8, CLA, CD45RA, and CD45RO expression on T cell lines derived from sorted CCR8+ cells corresponding to gates R2 in a. Numbers in a and b represent the percentage of cells within each quadrant. (c) Chemotactic migration of cultured CD4+ T cells as shown in b in response to chemokines as indicated. Migration is expressed as chemotactic index, which is the ratio of cells migrated in response to chemokines versus medium (no chemokine). CD8+ T cell lines gave similar results (not depicted). Data are representative of three independent experiments.
Figure 4.
Figure 4.
A small subset of peripheral blood CD4+CD25+ regulatory T cells expresses CCR8. (a) CCR8 expression (shaded histograms) was analyzed on positively selected CD4+CD25+ peripheral blood T cells after gating for CLA (R1) and CLA+ (R2) cells. Expression of CCR4 is shown in bold lines, and control stainings are shown in thin lines. (b) CCR8-expressing CD4+CD25+ T cells suppress proliferation of autologous CD4+ memory T cells as measured by [3H]thymidine incorporation after 5 d coculture in the presence of irradiated heterologous PBMCs. Suppressive activity of sorted CCR8+ Treg cells was compared with the two major subsets of CCR8-negative Treg cells distinguished by the presence (CLA+CCR8CD25+) or absence (CLACCR8CD25+) of CLA. Control denotes T cell proliferation in the absence of autologous Treg cells. (c) CLA+ Treg cells show reduced migration responses to CCL1. Migration of CLA (black bars) and CLA+ (white bars) Treg cells in response to indicated chemokines is expressed as migrated cells in percentage of input cells. CCR8 expression and function data are representative of three to seven independent experiments.
Figure 5.
Figure 5.
Localization of CCL1 in normal human skin. Immunohistochemistry was performed on paraffin-embedded sections from healthy abdominal skin tissue. (a) CCL1 (red staining) is shown in scattered cells throughout the superficial dermal plexus and epidermis; inset depicts isotype control antibody staining. (b) Staining of serial skin sections demonstrates overlapping expression of CCL1 and CD31 (blood vessels), but not podoplanin (lymphatic vessels) within the superficial dermal plexus. (c) Sequential for CCL1 and CD3 excludes T cells as major CCL1 producers. (d) Serial section analysis of healthy epidermis indicates CCL1 expression in melan-A–positive melanocytes in the basal layer of keratinocytes and S-100–positive LCs in the upper epidermis. (e) Serial staining for CCL1 and CD1a in normal epidermis. (f and g) Double immunofluorescence analysis demonstrates the presence of CCL1 (red) in CD31-positive dermal microvessels (green). (h and i) In agreement with serial section analysis, LCs (S-100bright, vimentinbright, in green) in the upper epidermis and melanocytes (S-100dim, vimentinbright, in green) in the basal keratinocyte layer coexpress CCL1 (red). Asterisks mark nonspecific staining of stratum corneum.
Figure 5.
Figure 5.
Localization of CCL1 in normal human skin. Immunohistochemistry was performed on paraffin-embedded sections from healthy abdominal skin tissue. (a) CCL1 (red staining) is shown in scattered cells throughout the superficial dermal plexus and epidermis; inset depicts isotype control antibody staining. (b) Staining of serial skin sections demonstrates overlapping expression of CCL1 and CD31 (blood vessels), but not podoplanin (lymphatic vessels) within the superficial dermal plexus. (c) Sequential for CCL1 and CD3 excludes T cells as major CCL1 producers. (d) Serial section analysis of healthy epidermis indicates CCL1 expression in melan-A–positive melanocytes in the basal layer of keratinocytes and S-100–positive LCs in the upper epidermis. (e) Serial staining for CCL1 and CD1a in normal epidermis. (f and g) Double immunofluorescence analysis demonstrates the presence of CCL1 (red) in CD31-positive dermal microvessels (green). (h and i) In agreement with serial section analysis, LCs (S-100bright, vimentinbright, in green) in the upper epidermis and melanocytes (S-100dim, vimentinbright, in green) in the basal keratinocyte layer coexpress CCL1 (red). Asterisks mark nonspecific staining of stratum corneum.

Similar articles

Cited by

References

    1. Von Andrian, U.H., and C.R. Mackay. 2000. T-cell function and migration. Two sides of the same coin. N. Engl. J. Med. 343:1020–1034. - PubMed
    1. Moser, B., and P. Loetscher. 2001. Lymphocyte traffic control by chemokines. Nat. Immunol. 2:123–128. - PubMed
    1. Kunkel, E.J., and E.C. Butcher. 2002. Chemokines and the tissue-specific migration of lymphocytes. Immunity. 16:1–4. - PubMed
    1. Dewald, B., M. Thelen, and M. Baggiolini. 1988. Two transduction sequences are necessary for neutrophil activation by receptor agonists. J. Biol. Chem. 263:16179–16184. - PubMed
    1. Sallusto, F., D. Lenig, R. Förster, M. Lipp, and A. Lanzavecchia. 1999. Two subsets of memory T lymphocytes with distinct homing potentials and effector functions. Nature. 401:708–712. - PubMed

Publication types