Comparative Study
. 2004 May 5:5:8.
doi: 10.1186/1471-2156-5-8.

Simultaneous quantitative and allele-specific expression analysis with real competitive PCR

Affiliations
Comparative Study

Simultaneous quantitative and allele-specific expression analysis with real competitive PCR

Chunming Ding et al. BMC Genet. .

Abstract

Background: For a diploid organism such as human, the two alleles of a particular gene can be expressed at different levels due to X chromosome inactivation, gene imprinting, different local promoter activity, or mRNA stability. Recently, imbalanced allelic expression was found to be common in human and can follow Mendelian inheritance. Here we present a method that employs real competitive PCR for allele-specific expression analysis.

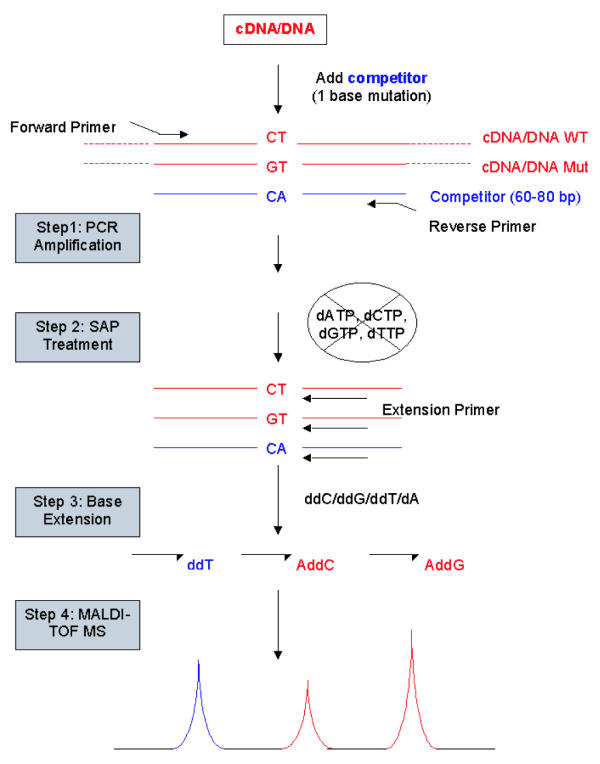
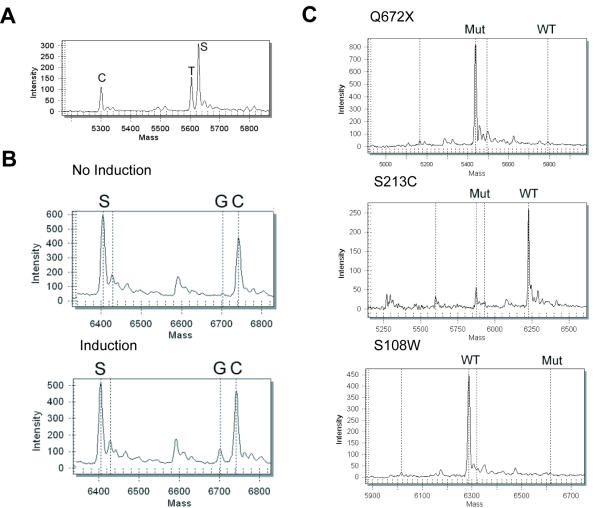
Results: A transcribed mutation such as a single nucleotide polymorphism (SNP) is used as the marker for allele-specific expression analysis. A synthetic mutation created in the competitor is close to a natural mutation site in the cDNA sequence. PCR is used to amplify the two cDNA sequences from the two alleles and the competitor. A base extension reaction with a mixture of ddNTPs/dNTP is used to generate three oligonucleotides for the two cDNAs and the competitor. The three products are identified and their ratios are calculated based on their peak areas in the MALDI-TOF mass spectrum. Several examples are given to illustrate how allele-specific gene expression can be applied in different biological studies.

Conclusions: This technique can quantify the absolute expression level of each individual allele of a gene with high precision and throughput.


Figures

Figure 1
Figure 1
Schematic view of quantitative and allele-specific expression analysis with real competitive PCR. A point mutation in the cDNA sequence is used as the marker for allele-specific gene expression analysis. The competitor is designed to have a synthetic mutation next to the natural mutation and is used for quantitative gene expression analysis. Three extension products from the two cDNA sequences and the competitor have different molecular weights, and are detected by MALDI-TOF MS. The peak area ratios of these products represent accurately the concentration ratios of the two cDNAs and the competitor. Since the absolute quantity of the competitor is known, the absolute quantities of the two cDNA sequences can be readily calculated.
Figure 2
Figure 2
Mass spectra for allele-specific expression analysis. (A) Interleukin 6 gene. Peaks are identified by C, T and S. C represents the allele where the polymorphic site has a C residue. T represents the allele where the polymorphic site has a T residue. S represents the competitor. The peak areas of C, T and S peaks are automatically computed by the RT software package (SEQUENOM). The peak area ratios represent the concentration ratios of the starting cDNA sequences and the competitor. The peak frequencies are 0.209, 0.263 and 0.528 for peak C, T and S, respectively. (B) lexA gene. Peak S, G and C represent the competitor, the exogenous and the endogenous lexA gene, respectively. Without arabinose induction, only endogenous lexA gene expression was seen. With modest arabinose induction, both the endogenous and exogenous lexA gene expression were seen. Without induction, the peak frequencies are 0.601, 0.004 and 0.395 for peak S, G and C, respectively. With induction, the peak frequencies are 0.509, 0.075 and 0.416 for peak S, G and C, respectively. (C) ABCD-1 gene. Mut and WT represent mutant and wild type alleles, respectively. For Q672X, the peak frequencies are 0.984 and 0.016 for peak Mut and WT, respectively. For S213C, the peak frequencies are 0.187 and 0.813 for peak Mut and WT, respectively. For S108W, the peak frequencies are 0.995 and 0.005 for peak WT and Mut, respectively.

References

    1. Cowles CR, Joel NH, Altshuler D, Lander ES. Detection of regulatory variation in mouse genes. Nat Genet. 2002;32:432–437. doi: 10.1038/ng992. - DOI - PubMed
    1. Momparler RL. Cancer epigenetics. Oncogene. 2003;22:6479–6483. doi: 10.1038/sj.onc.1206774. - DOI - PubMed
    1. Lo HS, Wang Z, Hu Y, Yang HH, Gere S, Buetow KH, Lee MP. Allelic variation in gene expression is common in the human genome. Genome Res. 2003;13:1855–1862. doi: 10.1101/gr.885403. - DOI - PMC - PubMed
    1. Bray NJ, Buckland PR, Owen MJ, O'Donovan MC. Cis-acting variation in the expression of a high proportion of genes in human brain. Hum Genet. 2003;113:149–153. - PubMed
    1. Yan H, Yuan W, Velculescu VE, Vogelstein B, Kinzler KW. Allelic variation in human gene expression. Science. 2002;297:1143. doi: 10.1126/science.1072545. - DOI - PubMed

Publication types

MeSH terms

LinkOut - more resources