

Statistical monitoring of weak spots for improvement of normalization and ratio estimates in microarrays
- PMID: 15128432
- PMCID: PMC415561
- DOI: 10.1186/1471-2105-5-53
Statistical monitoring of weak spots for improvement of normalization and ratio estimates in microarrays
Abstract
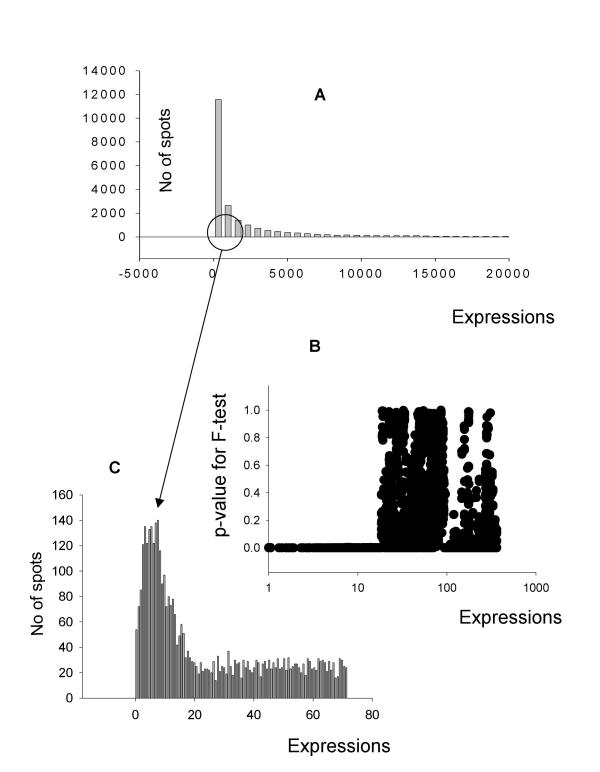
Background: Several aspects of microarray data analysis are dependent on identification of genes expressed at or near the limits of detection. For example, regression-based normalization methods rely on the premise that most genes in compared samples are expressed at similar levels and therefore require accurate identification of nonexpressed genes (additive noise) so that they can be excluded from the normalization procedure. Moreover, key regulatory genes can maintain stringent control of a given response at low expression levels. If arbitrary cutoffs are used for distinguishing expressed from nonexpressed genes, some of these key regulatory genes may be unnecessarily excluded from the analysis. Unfortunately, no accurate method for differentiating additive noise from genes expressed at low levels is currently available.
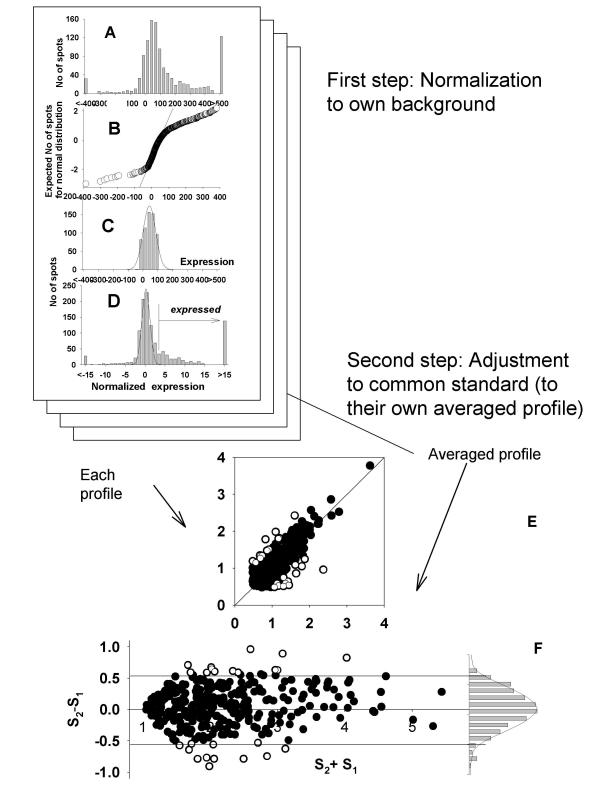
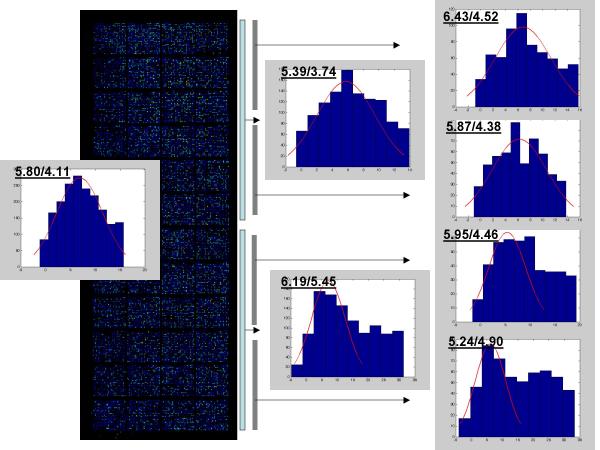
Results: We developed a multistep procedure for analysis of mRNA expression data that robustly identifies the additive noise in a microarray experiment. This analysis is predicated on the fact that additive noise signals can be accurately identified by both distribution and statistical analysis.
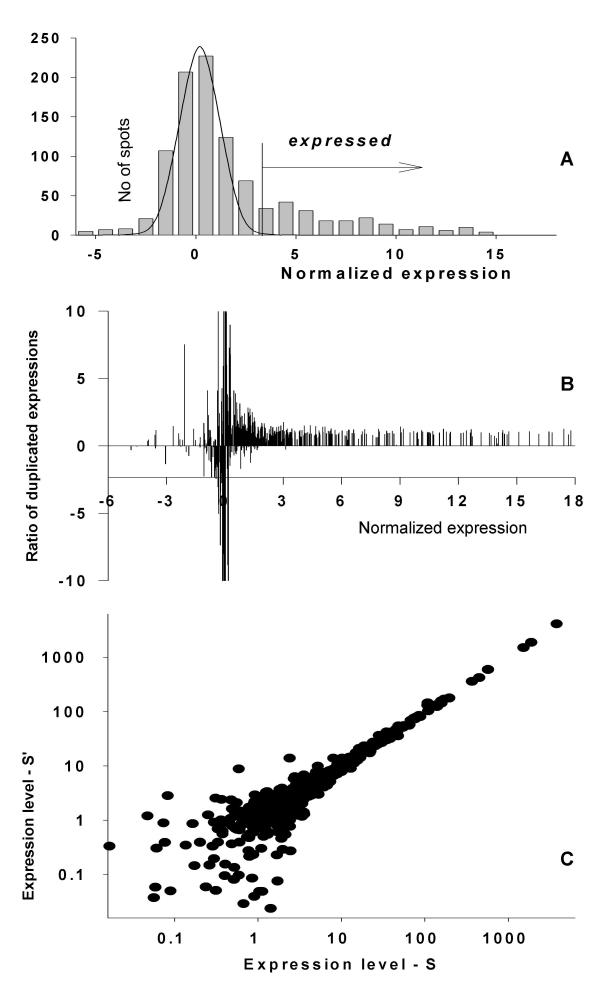
Conclusions: Identification of additive noise in this manner allows exclusion of noncorrelated weak signals from regression-based normalization of compared profiles thus maximizing the accuracy of these methods. Moreover, genes expressed at very low levels can be clearly identified due to the fact that their expression distribution is stable and distinguishable from the random pattern of additive noise.
Figures
Similar articles
-
Effect of local background intensities in the normalization of cDNA microarray data with a skewed expression profiles.Exp Mol Med. 2002 Jul 31;34(3):224-32. doi: 10.1038/emm.2002.31. Exp Mol Med. 2002. PMID: 12216114
-
Systematic approaches for incorporating control spots and data quality information to improve normalization of cDNA microarray data.J Biopharm Stat. 2007;17(3):415-31. doi: 10.1080/10543400701199544. J Biopharm Stat. 2007. PMID: 17479391
-
A statistical method for flagging weak spots improves normalization and ratio estimates in microarrays.Physiol Genomics. 2001 Oct 10;7(1):45-53. doi: 10.1152/physiolgenomics.00020.2001. Physiol Genomics. 2001. PMID: 11595791
-
Microarray data quality control improves the detection of differentially expressed genes.Genomics. 2010 Mar;95(3):138-42. doi: 10.1016/j.ygeno.2010.01.003. Epub 2010 Jan 14. Genomics. 2010. PMID: 20079422 Review.
-
Normalization and quantification of differential expression in gene expression microarrays.Brief Bioinform. 2006 Jun;7(2):166-77. doi: 10.1093/bib/bbl002. Epub 2006 Mar 7. Brief Bioinform. 2006. PMID: 16772260 Review.
Cited by
-
An alternative method to amplify RNA without loss of signal conservation for expression analysis with a proteinase DNA microarray in the ArrayTube format.BMC Genomics. 2006 Jun 12;7:144. doi: 10.1186/1471-2164-7-144. BMC Genomics. 2006. PMID: 16768788 Free PMC article.
-
Differential effects of selective frankincense (Ru Xiang) essential oil versus non-selective sandalwood (Tan Xiang) essential oil on cultured bladder cancer cells: a microarray and bioinformatics study.Chin Med. 2014 Jul 2;9:18. doi: 10.1186/1749-8546-9-18. eCollection 2014. Chin Med. 2014. PMID: 25006348 Free PMC article.
-
Serum IgG Profiling of Toddlers Reveals a Subgroup with Elevated Seropositive Antibodies to Viruses Correlating with Increased Vaccine and Autoantigen Responses.J Clin Immunol. 2021 Jul;41(5):1031-1047. doi: 10.1007/s10875-021-00993-w. Epub 2021 Mar 3. J Clin Immunol. 2021. PMID: 33656624 Free PMC article.
-
Elevated AKR1C3 expression promotes prostate cancer cell survival and prostate cell-mediated endothelial cell tube formation: implications for prostate cancer progression.BMC Cancer. 2010 Dec 6;10:672. doi: 10.1186/1471-2407-10-672. BMC Cancer. 2010. PMID: 21134280 Free PMC article.
-
Unique patterns of molecular profiling between human prostate cancer LNCaP and PC-3 cells.Prostate. 2009 Jul 1;69(10):1077-90. doi: 10.1002/pros.20960. Prostate. 2009. PMID: 19343732 Free PMC article.
References
-
- Dozmorov I, Saban MR, Gerard NP, Lu B, Nguyen NB, Centola M, Saban R. Neurokinin 1 receptors and neprilysin modulation of mouse bladder generegulation. Physiol Genmics. 2003;12:239–250. - PubMed
-
- Yang MC, Ruan QG, Yang JJ, Eckenrode S, Wu S, McIndoe RA, She JX. A statistical method for flagging weak spots improves normalization and ratio estimates in microarrays. Physiol Genomics. 2001;7:45–53. - PubMed
Publication types
MeSH terms
Substances
Grants and funding
LinkOut - more resources
Full Text Sources
Other Literature Sources
