

Multi-tissue gene-expression analysis in a mouse model of thyroid hormone resistance
- PMID: 15128445
- PMCID: PMC416467
- DOI: 10.1186/gb-2004-5-5-r31
Multi-tissue gene-expression analysis in a mouse model of thyroid hormone resistance
Abstract
Background: Resistance to thyroid hormone (RTH) is caused by mutations of the thyroid hormone receptor beta (TRbeta) gene. To understand the transcriptional program underlying TRbeta mutant-induced phenotypic expression of RTH, cDNA microarrays were used to profile the expression of 11,500 genes in a mouse model of human RTH.
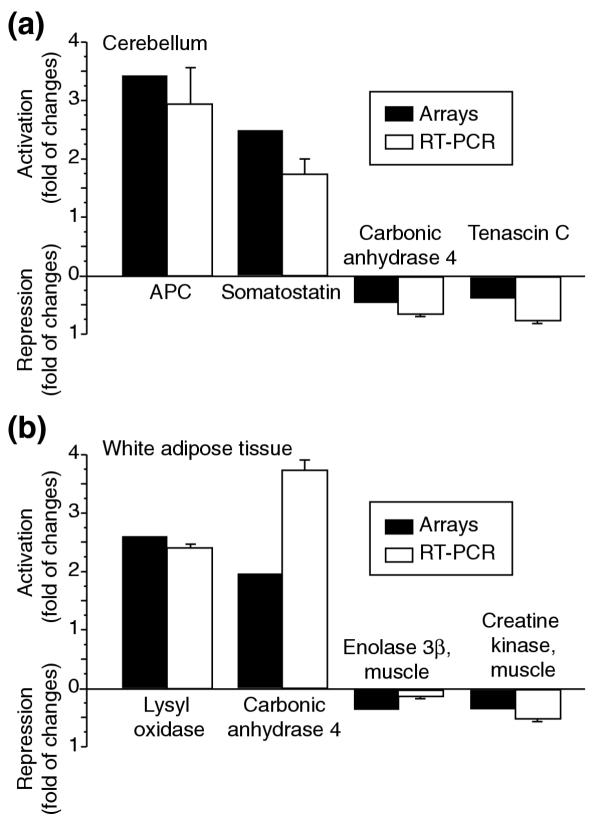
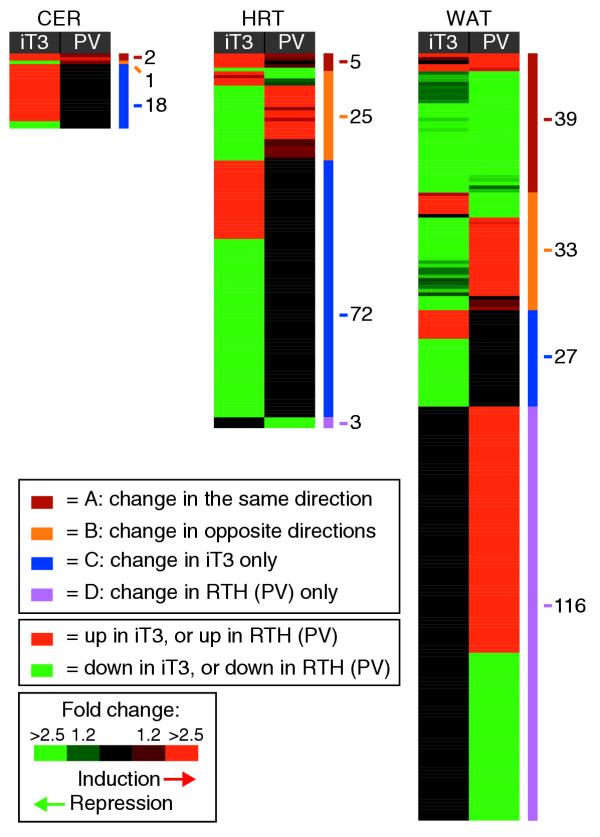
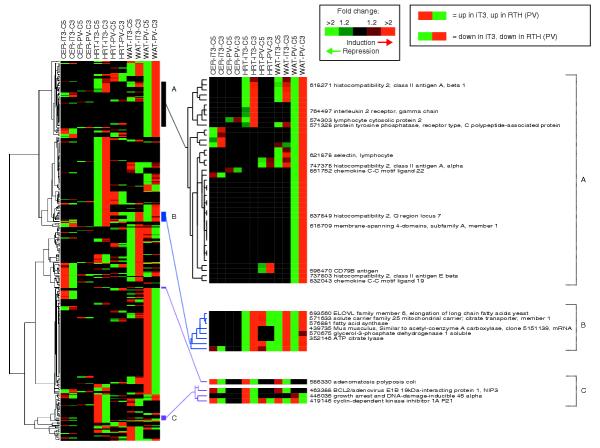
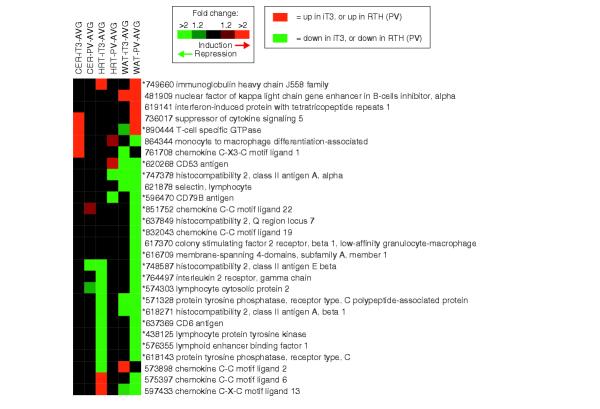
Results: We analyzed transcript levels in cerebellum, heart and white adipose tissue from a knock-in mouse (TRbetaPV/PV mouse) that harbors a human mutation (referred to as PV) and faithfully reproduces human RTH. Because TRbetaPV/PV mice have elevated thyroid hormone (T3), to define T3-responsive genes in the context of normal TRbeta, we also analyzed T3 effects in hyperthyroid wild-type gender-matched littermates. Microarray analysis revealed 163 genes responsive to T3 treatment and 187 genes differentially expressed between TRbetaPV/PV mice and wild-type littermates. Both the magnitude and gene make-up of the transcriptional response varied widely across tissues and conditions. We identified genes modulated in T3-dependent PV-independent, T3- and PV-dependent, and T3-independent PV-dependent pathways that illuminated the biological consequences of PV action in vivo. Most T3-responsive genes that were dysregulated in the heart and white adipose tissue of TRbetaPV/PV mice were repressed in T3-treated wild-type mice and upregulated in TRbetaPV/PV mice, suggesting the inappropriate activation of T3-suppressed genes in RTH.
Conclusions: Comprehensive multi-tissue gene-expression analysis uncovered complex multiple signaling pathways that mediate the molecular actions of TRbeta mutants in vivo. In particular, the T3-independent mutant-dependent genomic response unveiled the contribution of a novel 'change-of-function' of TRbeta mutants to the pathogenesis of RTH. Thus, the molecular actions of TRbeta mutants are more complex than previously envisioned.
Figures
Similar articles
-
Differential expression of thyroid hormone receptor isoforms dictates the dominant negative activity of mutant Beta receptor.Mol Endocrinol. 2002 Sep;16(9):2077-92. doi: 10.1210/me.2002-0080. Mol Endocrinol. 2002. PMID: 12198244
-
Marked potentiation of the dominant negative action of a mutant thyroid hormone receptor beta in mice by the ablation of one wild-type beta allele.Mol Endocrinol. 2003 May;17(5):895-907. doi: 10.1210/me.2002-0326. Epub 2003 Feb 6. Mol Endocrinol. 2003. PMID: 12576488
-
Recessive resistance to thyroid hormone in mice lacking thyroid hormone receptor beta: evidence for tissue-specific modulation of receptor function.EMBO J. 1996 Jun 17;15(12):3006-15. EMBO J. 1996. PMID: 8670802 Free PMC article.
-
Isoform-dependent actions of thyroid hormone nuclear receptors: lessons from knockin mutant mice.Steroids. 2005 May-Jun;70(5-7):450-4. doi: 10.1016/j.steroids.2005.02.003. Epub 2005 Mar 16. Steroids. 2005. PMID: 15862829 Review.
-
Thyroid hormone receptor mutations and disease: beyond thyroid hormone resistance.Trends Endocrinol Metab. 2005 May-Jun;16(4):176-82. doi: 10.1016/j.tem.2005.03.008. Trends Endocrinol Metab. 2005. PMID: 15860414 Review.
Cited by
-
Sarcolipin and phospholamban mRNA and protein expression in cardiac and skeletal muscle of different species.Biochem J. 2005 Jul 1;389(Pt 1):151-9. doi: 10.1042/BJ20050068. Biochem J. 2005. PMID: 15801907 Free PMC article.
-
Studies of complex biological systems with applications to molecular medicine: the need to integrate transcriptomic and proteomic approaches.J Biomed Biotechnol. 2011;2011:810242. doi: 10.1155/2011/810242. Epub 2010 Oct 11. J Biomed Biotechnol. 2011. PMID: 20981256 Free PMC article. Review.
-
Novel functions of thyroid hormone receptor mutants: beyond nucleus-initiated transcription.Steroids. 2007 Feb;72(2):171-9. doi: 10.1016/j.steroids.2006.11.005. Epub 2006 Dec 13. Steroids. 2007. PMID: 17169389 Free PMC article. Review.
-
Nexus between epidermolysis bullosa and transcriptional regulation by thyroid hormone in epidermal keratinocytes.Clin Transl Sci. 2008 May;1(1):45-9. doi: 10.1111/j.1752-8062.2008.00015.x. Clin Transl Sci. 2008. PMID: 20443817 Free PMC article.
-
Differential transcriptome regulation by 3,5-T2 and 3',3,5-T3 in brain and liver uncovers novel roles for thyroid hormones in tilapia.Sci Rep. 2017 Nov 8;7(1):15043. doi: 10.1038/s41598-017-14913-9. Sci Rep. 2017. PMID: 29118400 Free PMC article.
References
-
- Yen PM. Physiological and molecular basis of thyroid hormone action. Physiol Rev. 2001;81:1097–1142. - PubMed
-
- O'Shea PJ, Williams GR. Insight into the physiological actions of thyroid hormone receptors from genetically modified mice. J Endocrinol. 2002;175:553–570. - PubMed
-
- Forrest D, Vennstrom B. Functions of thyroid hormone receptors in mice. Thyroid. 2000;10:41–52. - PubMed
Publication types
MeSH terms
Substances
LinkOut - more resources
Full Text Sources
Molecular Biology Databases
