

Comparative Study
doi: 10.1186/gb-2004-5-5-r35.
Epub 2004 Apr 16.
Prolinks: a database of protein functional linkages derived from coevolution
Affiliations
- PMID: 15128449
- PMCID: PMC416471
- DOI: 10.1186/gb-2004-5-5-r35
Item in Clipboard
Comparative Study
Prolinks: a database of protein functional linkages derived from coevolution
Genome Biol.
2004.
Abstract
The advent of whole-genome sequencing has led to methods that infer protein function and linkages. We have combined four such algorithms (phylogenetic profile, Rosetta Stone, gene neighbor and gene cluster) in a single database--Prolinks--that spans 83 organisms and includes 10 million high-confidence links. The Proteome Navigator tool allows users to browse predicted linkage networks interactively, providing accompanying annotation from public databases. The Prolinks database and the Proteome Navigator tool are available for use online at http://dip.doe-mbi.ucla.edu/pronav.
Figures
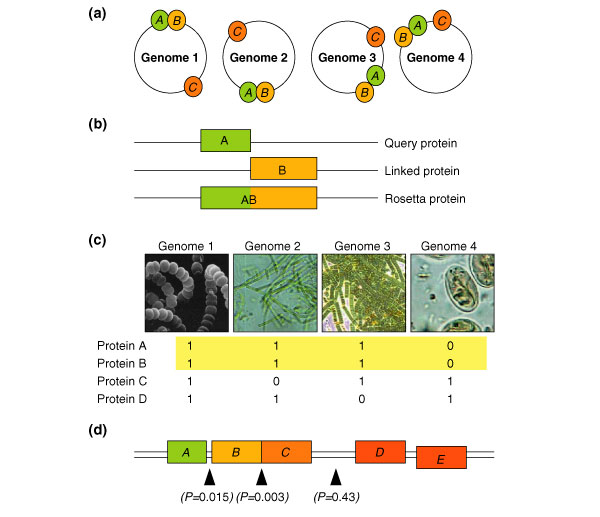
The general mechanism of inference for each of the four methods used by the Proteome Navigator. (a) The gene neighbor (GN) method identifies protein pairs encoded in close proximity across multiple genomes. We see in this example that genes A and B are gene neighbors while A and C are not. (b) The Rosetta Stone (RS) method searches for gene fusion events. We see that the A and B proteins are expressed as separate proteins in one organism. However, in a second organism a sequence exists that represents the fusion of the two proteins. The fusion protein is termed the Rosetta Stone protein as it allows us to infer that the A and B proteins are functionally linked. (c) The construction of phylogenetic profiles (PP) begins with four sequenced genomes, from which the protein sequences have been predicted. The protein sequence, A, within E. coli is compared to that of the proteins coded by the other genomes and homologs are identified. If the genome contains a homolog of A, a 1 is placed in the corresponding phylogenetic profile position, a 0 otherwise. Genes with similar phylogenetic profiles are likely to participate in the same pathway. (d) The gene cluster (GC) or operon method identifies closely spaced genes, and assigns a probability P of observing a particular gap distance (or smaller), as judged by the collective set of inter-gene distances.
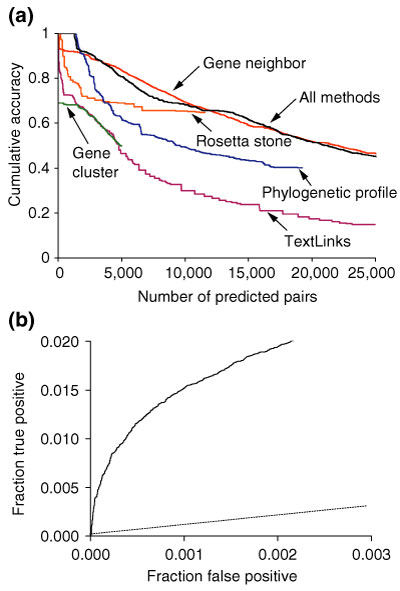
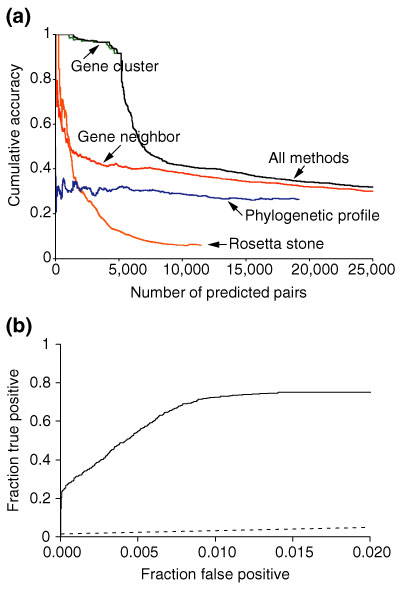
We assess COG category recovery for the four individual methods, the combination of the four methods, and TextLinks. (a) We assign a confidence measure to the likelihood that a pair of proteins is acting within the same COG pathway, reflecting the number of COG-annotated pairs that lie within the same pathway relative to the total number of annotated pairs. The COG confidence metric is used in the network-graphing function of the Proteome Navigator to select inferred protein linkages with uniform confidence. E. coli protein pairs displayed in this figure have a COG pathway confidence recovery (cumulative accuracy) of greater than 0.4, with the exception of the TextLinks pairs. (b) The receiver operator characteristic (ROC) curve shows the performance of the rank-ordered list of all E. coli interactions predicted from genomic inference (solid line) compared with the random selection of protein pairs (dashed line).
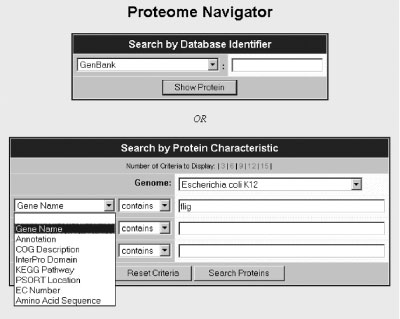
The opening page of the Proteome Navigator prompts the user to select a protein by database identifier or protein name or ID, as well as selecting the genome of interest. Pull-down tabs facilitate the selection of protein features and microbial genomes. Here we select the E. coli gene 'fliG'. Clicking the 'Search Proteins' button takes the user to a page displaying all of the proteins that satisfy the search criteria (see Figure 4).
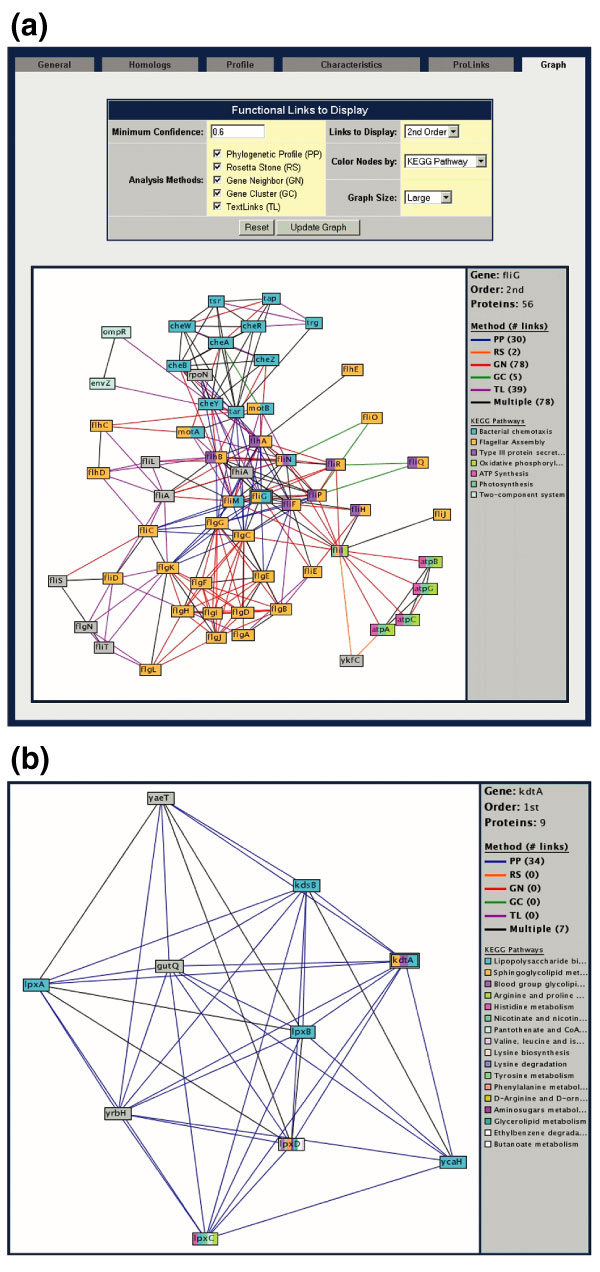
The 'Graphing' function of the Proteome Navigator displays the network of interactions satisfying the input search criterion. (a) Nodes are colored by functional categories explained in the right-hand border. Edges connecting proteins are colored by the method predicting the interaction, also described in the figure border. Associations predicted by multiple methods are shown in black. The double box around fliG indicates that this was the input protein used to generate this network. Clicking on a node brings the user to a protein-annotation page, and the search can be continued using the new protein to generate a new network search. (b) An example of functional discovery using Prolinks. Using kdtA as the initial seed, we speculate that GutQ, an uncharacterized E. coli protein, may be associated with lipopolysaccharide and cell-wall synthesis. Confirmation of these predictions awaits further scientific inquiry.
Assessment of the four methods by recovery of links between members of known E. coli protein complexes. (a) We test to see how often predicted interacting protein pairs are subunits of the same protein complex. E. coli protein complexes were obtained from the EcoCyc database. (b) Again, the ROC curve shows the performance of the rank-ordered list of all E. coli predicted interactions (solid line) compared with the random selection of protein pairs (dashed line), in their ability to recover constituents of known protein complexes.
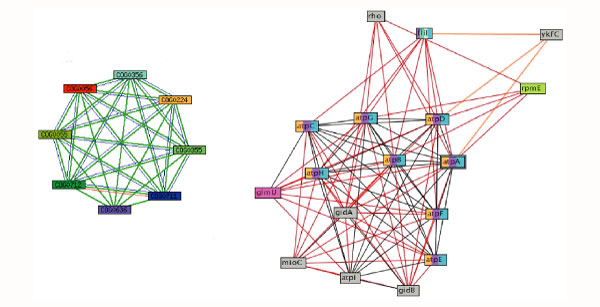
A comparison of graphs generated by querying the String database and Proteome Navigator to identify proteins in the ATP synthase complex. COG0056, shown in red in the String network (left), contains the E. coli protein AtpA, used to search each database and shown highlighted as a double-lined box in the Proteome Navigator graph (right). The Proteome Navigator network and Prolinks database identify twice the number of functionally linked proteins at the given confidence level.
References
Publication types
MeSH terms
Substances
LinkOut - more resources
Full Text Sources
Other Literature Sources
Molecular Biology Databases
