. 2004 Nov;92(5):3121-33.
doi: 10.1152/jn.00234.2004. Epub 2004 May 5.

In vivo mammalian brain imaging using one- and two-photon fluorescence microendoscopy

Affiliations

In vivo mammalian brain imaging using one- and two-photon fluorescence microendoscopy

Juergen C Jung et al. J Neurophysiol. 2004 Nov.

Abstract

One of the major limitations in the current set of techniques available to neuroscientists is a dearth of methods for imaging individual cells deep within the brains of live animals. To overcome this limitation, we developed two forms of minimally invasive fluorescence microendoscopy and tested their abilities to image cells in vivo. Both one- and two-photon fluorescence microendoscopy are based on compound gradient refractive index (GRIN) lenses that are 350-1,000 microm in diameter and provide micron-scale resolution. One-photon microendoscopy allows full-frame images to be viewed by eye or with a camera, and is well suited to fast frame-rate imaging. Two-photon microendoscopy is a laser-scanning modality that provides optical sectioning deep within tissue. Using in vivo microendoscopy we acquired video-rate movies of thalamic and CA1 hippocampal red blood cell dynamics and still-frame images of CA1 neurons and dendrites in anesthetized rats and mice. Microendoscopy will help meet the growing demand for in vivo cellular imaging created by the rapid emergence of new synthetic and genetically encoded fluorophores that can be used to label specific brain areas or cell classes.


Figures

fig. 1
fig. 1
Optical designs for one-photon fluorescence endoscopy. A: photograph of three gradient refractive index (GRIN) doublet microendoscope probes, 1,000-, 500-, and 350-μm diam, oriented with objective lens down. The relay lenses exhibit a dark coating. One minor tick on the scale equals 1.0 mm. B: optical layout used for the endoscopic studies of Figs. 2-5. A mercury (Hg) arc lamp provides fluorescence excitation light, which reflects off a cold mirror and couples into a 1-mm diam optical fiber. Excitation light passes through a fluorescence excitation filter and is deflected onto the main optical axis by a dichroic mirror. A microscope objective lens delivers the excitation light into the microendoscope probe. The imaging plane in the sample may be adjusted by moving either the probe or the microscope objective. Fluorescence emissions (dashed lines) pass back through the microendoscope probe, microscope objective, dichroic mirror, and an emission filter, and are focused onto a CCD camera. C: optical diagram of light rays in a doublet microendoscope probe with a relay lens of length ¼-pitch. An object that is located at the working distance of the endoscopic objective lens is imaged just outside the external face of the relay lens. D: optical diagram of light rays in a doublet microendoscope probe with a ¾-pitch relay.
fig. 2
fig. 2
Three methods for determination of endoscope resolution. A: image of a ruled grid of 1.6-μm-spacing obtained with a 1,000-μm diam endoscope possessing a 390-μm working distance (WD) and 0.46 NA. The image extends to the circular perimeter of the endoscopic relay, visible in the left of the photo. Top inset: magnified image of six grid lines, taken from the area boxed in black. Bottom inset: magnified image of six grid lines obtained using the same microendoscope probe and a grid of 1.0-μm spacing. B: one-dimensional image profiles of single 170-nm fluorescent beads, acquired in an axial plane through the bead center. Intensity values are normalized to maximum intensity at the bead center. □, data for a 500-μm-diam endoscope with 0.47 NA and 130-μm WD; ●, data for a 1,000-μm-diam endoscope with 0.46 NA and 390-μm WD; ◇, data for a 1,000-μm-diam endoscope with 0.38 NA and 1040-μm WD. There are three solid lines, which are parametric fits to an Airy disk, f(x) = [2 J1(kx)/(kx)]2, but two of these lines are nearly indistinguishable. Inset: image of a Siemens star, taken with the same 500-μm-diam endoscope used to image fluorescent beads.
fig. 3
fig. 3
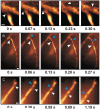
Movie frames of single red blood cell dynamics visualized in vivo using one-photon fluorescence microendoscopy. Compressed versions of these movies may be viewed in Data Supplements. Relative times in seconds are below each movie frame. Blue and white arrowheads point to individual red blood cells and track the cells’ progress within the vessels. A: sequence of movie frame images from the CA1 hippocampal area of a live mouse. This is an example of a “to-and-fro” flow pattern. B: sequence of movie frame images from CA1 hippocampus of a live rat. C: sequence of movie frame images from the laterodorsal thalamic nucleus of a live rat. All fluorescence images are presented in a pseudocolor scale, but no enhancement or filtering of raw image data has been performed. Frames in A–C were obtained with a 1,000-μm endoscope of 390-μm WD and 0.46 NA. Scale bars are 10 μm.
fig. 4
fig. 4
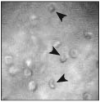
Still frame of individual red blood cells in rat somatosensory cortex, taken with the same microendoscope used for Fig. 3. Biconcave red blood cell structures are readily apparent (black arrowheads).
fig. 5
fig. 5
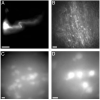
Mammalian neurons imaged in vivo using one-photon fluorescence microendoscopy. A: fluorescent Di-I-labeled neuron imaged within infragranular somatosensory cortex in an anesthetized rat, visualized with a 1,000-μm-diam endoscope probe with 130-μm WD and 0.48 NA. B–D: CA1 hippocampal pyramidal cells in anesthetized YFP-H mice were visualized with a 1,000-μm-diam endoscope probe with 390-μm WD and 0.46 NA positioned above the alveus. Without moving the probe, the image was focused B, on basal dendrites in stratum oriens, or C and D, on pyramidal cell bodies in stratum pyramidale. Scale bars are 10 μm.
fig. 6
fig. 6
Laser-scanning strategies for two-photon fluorescence endoscopy. A: a simple scanning strategy involves a microendoscope probe with a ¼-pitch relay lens (Fig. 1C). The collimated laser beam (red arrows) is focused onto the back face of the endoscope probe with an achromatic lens that provides a low NA focus matching that of the endoscopic relay lens. To achieve this low NA focus, the laser beam may underfill the lens aperture of the coupling lens, as shown. The laser focus is scanned across the face of the endoscopic relay lens (dashed arrow line). The probe demagnifies and translates the scanning pattern to the image plane within the tissue sample (dashed arrow line). A portion of the two-photon excited fluorescence (green arrows) that is induced at the sample focal spot returns through the endoscope probe and is separated from the laser excitation by a dichroic mirror. A lens focuses the fluorescence onto a photodetector. There are several variants of this strategy; for simplicity, the dichroic mirror and detection optics are omitted from B–D. B: this scanning strategy is identical to that shown in A except that an endoscope probe with a ¾-pitch is used (Fig. 1D). C: a scanning strategy using a triplet endoscope probe. The probe is comprised of an objective lens, a relay lens, and a ¼-pitch GRIN coupling lens with 0.5 NA, matching the NA of a 0.5 NA microscope objective that couples the excitation laser light into the probe (Jung and Schnitzer 2003). In this design, the optical magnification of the endoscope probe is close to unity for short working distances. D: an optical design in which the collimated laser beam pivots (signified by the curved dashed line) about the face of an endoscope probe with a relay lens of half-integral pitch. This angular deflection of the beam is converted into a lateral translation in the sample focal plane.
fig. 7
fig. 7
Optical schematic of the two-photon endoscope. A Ti:sapphire laser emits ~100-fs pulses of infrared excitation light. The laser beam is steered in two angular dimensions by a pair of galvanometer-driven deflector mirrors and is expanded in a telescope comprised of a scan lens and a tube lens. Either a microscope objective or an achromat (not depicted) focuses the beam to a focal spot just above the external face of the endoscope probe. The probe refocuses the lateral scan pattern within the specimen. The focal plane in the specimen may be adjusted by moving either the endoscope probe itself or the microscope objective. This enables one to set the endoscope probe position and to acquire optical sections by adjusting only the position of the microscope objective. Fluorescence emissions (dashed lines) returning from the sample are separated from the excitation beam by a dichroic mirror and detected by a photomultiplier tube (PMT). A computer controls the galvanometer deflectors and reconstructs the image of the sample.
fig. 8
fig. 8
Mammalian CA1 hippocampal neurons imaged in vivo with two-photon fluorescence microendoscopy. The endoscope probe is positioned atop the alveus in CA1. A: Di-I labeled dendrites in CA1 s. oriens of a live rat. The endoscope probe had a 1,000-μm diam, 0.48 NA, and a 130-μm WD. The image acquisition time was 0.77 s. B–F: in vivo two-photon microendoscopy images of fluorescent cell bodies, basal dendrites, and apical dendrites in CA1 s. pyramidale, s. oriens, and s. radiatum, respectively, in anesthetized YFP-H mice that express YFP in a subset of hippocampal pyramidal neurons (Feng et al. 2000). B: in vivo image of CA1 pyramidal cell basal dendrites in s. oriens. The endoscope probe had a 500-μm diam, 0.47 NA, and a 130-μm WD. Image acquisition time was 0.55 s. C: an image of over 25 pyramidal cell bodies taken with a 1,000-μm-diam endoscope with 1,040-μm WD and 0.38 NA. Image acquisition time was 0.38 s. D: in vivo image of pyramidal cell bodies using the same endoscope probe as in C but at higher digital magnification and with an acquisition time of 0.55 s. E: image of pyramidal cell bodies acquired in vivo with a 500-μm-diam endoscope probe, of 100-μm working distance and 0.47 NA. Image acquisition time was 0.55 s. F: two-photon image of larger dendrites in s. radiatum, ventral but proximal to s. pyramidale. The endoscope probe and acquisition time were identical to that used in E, but the digital magnification was increased. All scale bars are 10 μm.

References

    1. Akaaboune M, Grady RM, Turney S, Sanes JR, Lichtman JW. Neurotransmitter receptor dynamics studied in vivo by reversible photo-unbinding of fluorescent ligands. Neuron. 2002;34:865–876. - PubMed
    1. Anandh B, Mohanty A, Sampath S, Praharaj SS, Kolluri S. Endoscopic approach to intraventricular cysticercal lesions. Minim Invasive Neurosurg. 2001;44:194–196. - PubMed
    1. Antonucci DE, Lim ST, Vassanelli S, Trimmer JS. Dynamic localization and clustering of dendritic Kv2.1 voltage-dependent potassium channels in developing hippocampal neurons. Neuroscience. 2001;108:69–81. - PubMed
    1. Balice-Gordon RJ, Lichtman JW. Long-term synapse loss induced by focal blockade of postsynaptic receptors. Nature. 1994;372:519–524. - PubMed
    1. Beaurepaire E, Oheim M, Mertz J. Ultra-deep two-photon fluorescence excitation in turbid media. Opt Commun. 2001;188:25–29.

Publication types

Substances

LinkOut - more resources