. 2004 May 5;24(18):4382-92.
doi: 10.1523/JNEUROSCI.5570-03.2004.

Interplay between local GABAergic interneurons and relay neurons generates gamma oscillations in the rat olfactory bulb

Affiliations

Interplay between local GABAergic interneurons and relay neurons generates gamma oscillations in the rat olfactory bulb

Samuel Lagier et al. J Neurosci. .

Abstract

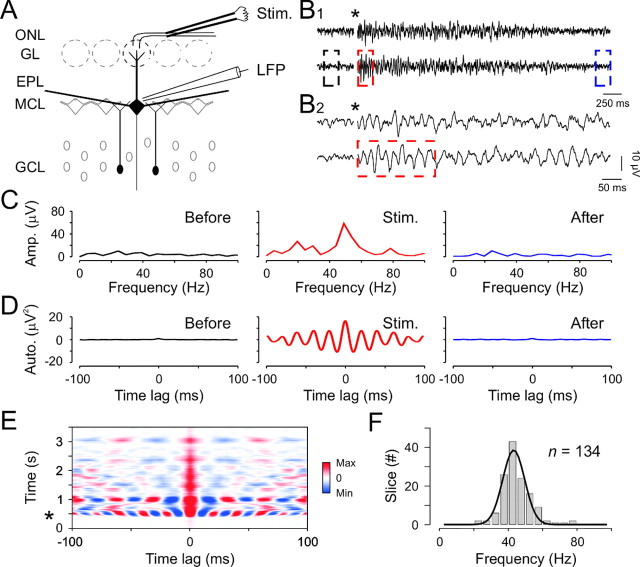
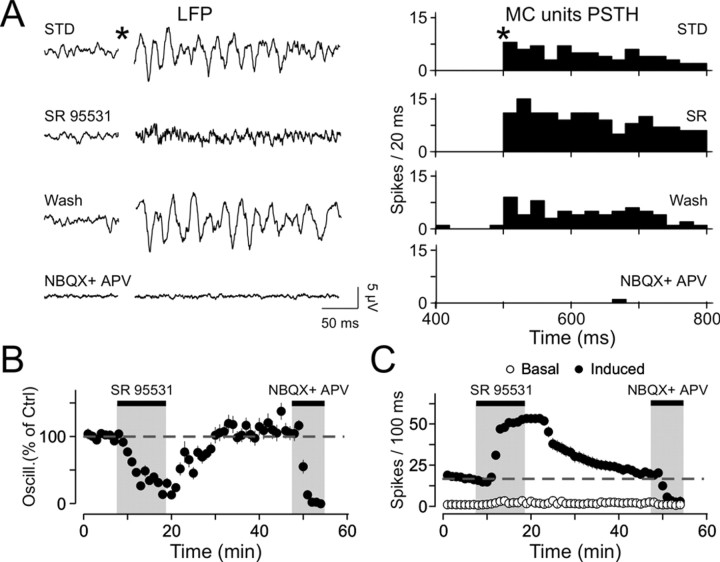
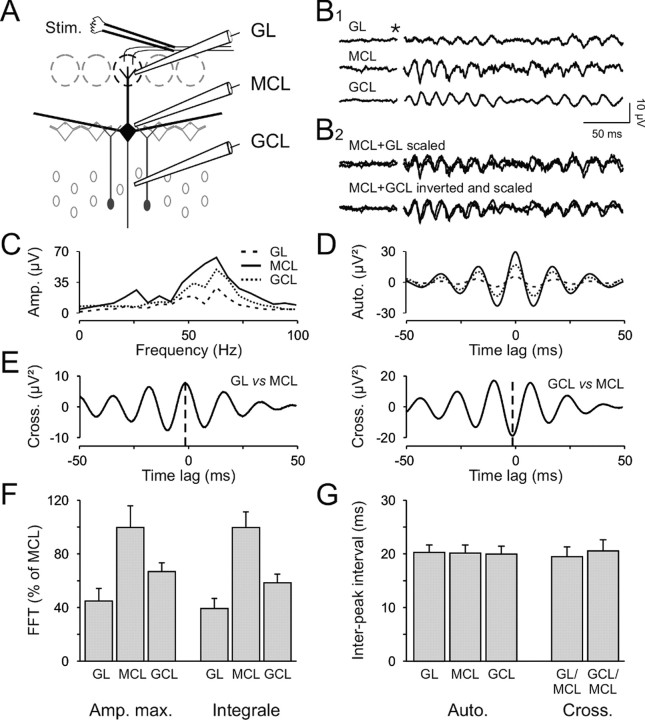
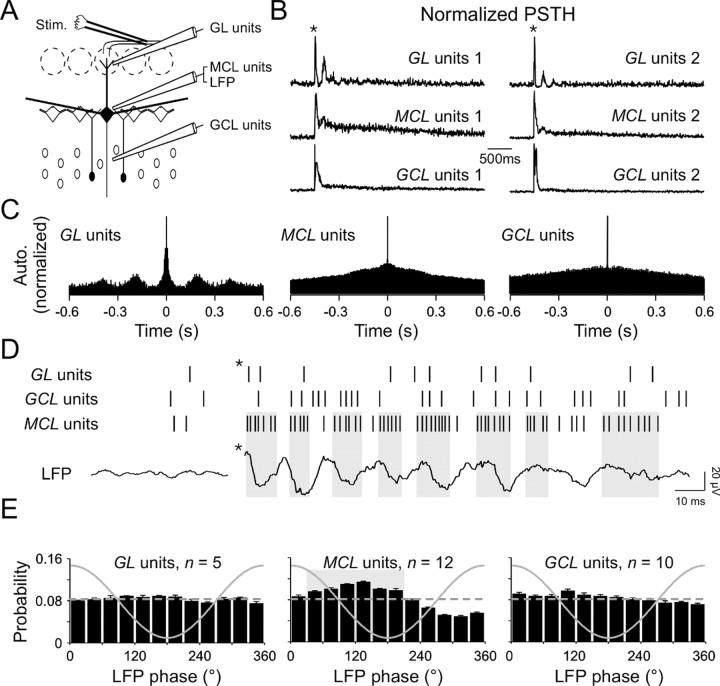
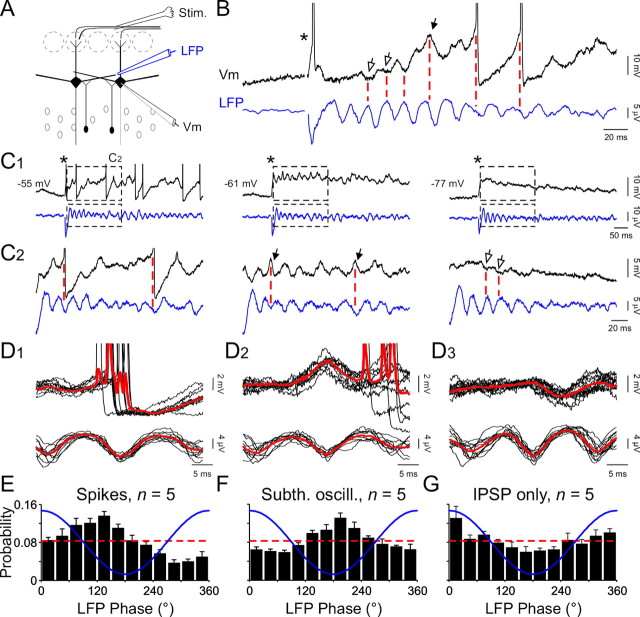
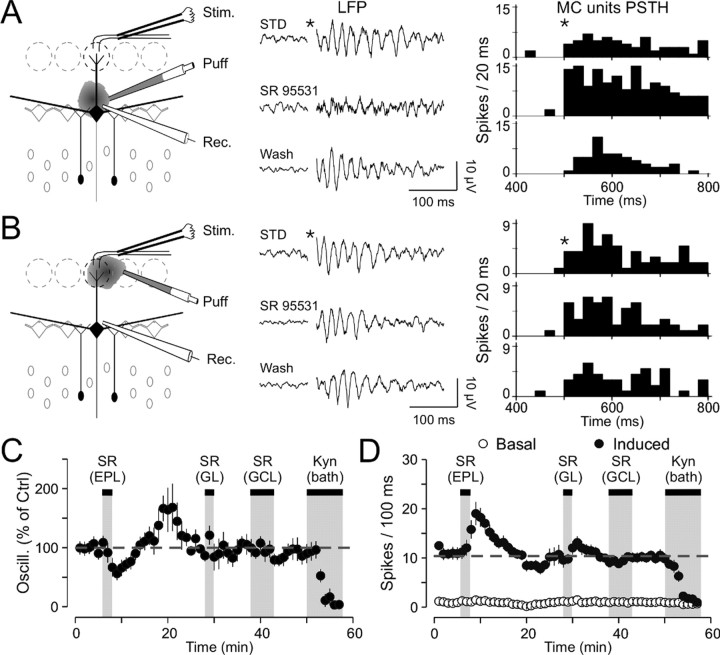
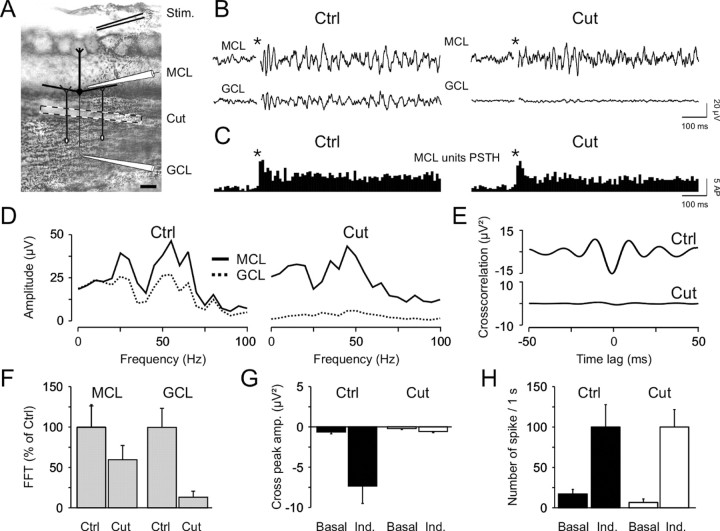
Olfactory stimuli have been known for a long time to elicit oscillations in olfactory brain areas. In the olfactory bulb (OB), odors trigger synchronous oscillatory activity that is believed to arise from the coherent and rhythmic discharges of large numbers of neurons. These oscillations are known to take part in encoding of sensory information before their transfer to higher subcortical and cortical areas. To characterize the cellular mechanisms underlying gamma (30-80 Hz) local field potential (LFP) oscillations, we simultaneously recorded multiunit discharges, intracellular responses, and LFP in rat OB slices. We showed that a single and brief electrical stimulation of olfactory nerve elicited LFP oscillations in the mitral cell body layer lasting >1 sec. Both action potentials and subthreshold oscillations of mitral/tufted cells, the bulbar output neurons, were precisely synchronized with LFP oscillations. This synchronization arises from the interaction between output neurons and granule cells, the main population of local circuit inhibitory interneurons, through dendrodendritic synapses. Interestingly enough, the synchronization exerted by reciprocal synaptic interactions did not require action potentials initiated in granule cell somata. Finally, local application of a GABA(A) receptor antagonist at the mitral cell and external plexiform layers confirmed the exclusive role of the granule cell reciprocal synapses in generating the evoked oscillations. We concluded that interneurons located in the granule cell layer generate synaptic activity capable of synchronizing activity of output neurons by interacting with both their subthreshold and spiking activity.


Figures

Figure 1.
Figure 1.
Olfactory nerve stimulation triggers long-lasting LFP oscillations in theγ frequency range. A, Experimental scheme. ONL, Olfactory nerve layer; Stim., bipolar stimulating electrode located in the ONL, LFP, local field potential recording electrode placed at the border between the MCL and the EPL. B1, Two individual traces illustrating LFP oscillations induced by olfactory nerve stimulation. The star indicates the stimulus onset, and the color dashed boxes indicate the parts of the signal used for the analysis in C and D. B2, Expanded time scale of the sweeps presented in B1. C, D, FFT (C) and autocorrelation (D) of the lower LFP signal in B1 before (Before), just after (Stim.), and 3500 msec after (After) the stimulation onset. The mathematical functions were calculated over 200 msec rectangular time windows shown in B (same color code). E, Sliding autocorrelation of the bottom LFP trace in B revealing the long-lasting and highly periodic oscillation. The star indicates the stimulus onset. F, Distribution of the averaged oscillation frequencies across slices.
Figure 5.
Figure 5.
LFP oscillations require inhibition to appear. A, LFP recordings (left plot) and corresponding mitral/tufted cells population PSTH (MC units PSTH; right plot) under different pharmacological conditions. Note the disappearance of oscillations and the increase in mitral/tufted cell discharge during bath application of SR95531 (SR). Bath application of NBQX and APV completely blocks both oscillations and mitral/tufted cells discharge. STD, Standard conditions. B, Average of five experiments showing the evolution of LFP oscillations over time. C, Average of five experiments showing the evolution of mitral/tufted cells discharge over time. Note the absence of variation of the baseline firing rate. The dashed line represents the mean induced firing rate in control conditions.
Figure 2.
Figure 2.
Simultaneous recordings in the different layers of the OB reveal the origin of LFP oscillations. A, Recording protocol. Three electrodes were placed simultaneously in the GL (top electrode), the GCL (bottom electrode), and at the border between the MCL and the EPL (middle electrode). Stim., Stimulus. B1, The olfactory nerve stimulation induced LFP oscillations in the three layers. The star indicates the stimulus onset. B2, Scaling (for the GL, GCL traces) and inversion (only for the GCL trace) of the traces in B1. C, D, FFT (C) and autocorrelograms (D) of the traces shown in B. E, Cross-correlations of the GL and MCL (left plot) and the GCL and MCL (right plot) signals. Note that the maximum peaks occur just before 0 msec (dashed line) and are, respectively, positive and negative for the GL–MCL and GCL–MCL cross-correlations. F, Quantification of FFT maximal amplitude (Amp. max.) and integral (20–100 Hz) for the three different recording locations (n = 7 slices). Note that the biggest signals were recorded at the border of the MCL. G, Mean periods found in the different recording locations calculated from the autocorrelograms (Auto.) and cross-correlograms (Cross.; n = 7 slices).
Figure 3.
Figure 3.
LFP oscillations reflect mitral/tufted cells synchronization. A, Experimental scheme. Extracellular signals are filtered (0.3–3 KHz) for spike detection. Stim., Stimulus. B, Normalized PSTH of extracellular unit recordings from 20 consecutive stimulations in two different slices (1, 2). Populations of glomerular layer interneurons (GL units), mitral/tufted cells (MCL units), and granule cells (GCL units) were recorded simultaneously. Note the presence of multiple peaks in glomerular layer unit recordings. The star indicates the stimulus onset. C, Normalized autocorrelograms of the PSTH recorded in slice 1 shown in B. Note the presence of satellite peaks in the GL unit autocorrelogram. D, Raster plot of glomerular layer, granule cell layer, and mitral cell layer units with their simultaneous LFP recorded near the MCL. Note the presence of groups of spikes in the MCL units raster and their coincidence with LFP descending phases (gray boxes). The star indicates the stimulus onset. E, Mean distribution of action potentials relative to the phase of LFP oscillations recorded near the MCL (solid line) for the glomerular layer interneurons (left plot; average length, 0.04 ± 0.01; range, 0.03–0.06), for the mitral/tufted cells (middle plot; average length, 0.2 ± 0.01; range, 0.12–0.25), and for granule cells (right plot; average length, 0.1 ± 0.03; range, 0.06–0.15). The gray box in the middle plot represents the period of highest occurrence probability of mitral/tufted cells firing, as shown in D. The dashed line represents a theoretical uniform distribution for comparison.
Figure 4.
Figure 4.
Mitral/tufted cell suprathreshold and subthreshold activities are precisely linked with LFP oscillations. A, Experimental scheme. Stim., Stimulus. B, Simultaneous LFP and a mitral cell intracellular recording (Vm) revealing the phasing of IPSPs (open arrows), putative intrinsic oscillations (black arrow), and action potentials (truncated) with LFP oscillations. C1, Simultaneous LFP and mitral cell intracellular recordings with progressive hyperpolarization of the same recorded cell in B. In B and C1, the star indicates the stimulus onset. C2, Enlargements of traces shown in C1 (black dashed boxes). Note that a slight hyperpolarization prevents the emission of spikes (middle plot) and reveals the phasing of putative intrinsic subthreshold oscillations with LFP (black arrows). A further hyperpolarization suppresses intrinsic membrane oscillations (right plot) and reveals the phasing of IPSPs (open arrows). D1, A lignment and superimposition of simultaneous intracellular (top black lines) and LFP (bottom black lines) recordings and their respective averages (red lines) revealing that spikes principally occur during the descending phase of LFP oscillation. D2, Same procedure as in D1 revealing that peaks of membrane oscillations principally occur during troughs of the LFP oscillations. D3, Same procedure as in D1 but with hyperpolarized cells revealing that IPSPs principally occur during peaks of LFP oscillations. E–G, Mean distribution of intracellular spikes (E), membrane subthreshold oscillation (Subth. oscill.) peaks (F), and IPSPs (G) relative to the phase of the LFP oscillation (blue line). The theoretical uniform distribution is represented by the dashed red line for comparison.
Figure 6.
Figure 6.
GC inhibition of mitral/tufted cells is a key element for generating LFP oscillations. A, Effects of local application of SR95531 in the EPL. Left diagram, Experimental scheme. Middle plot, LFP recordings under different pharmacological conditions. Right plot, PSTH of the mitral/tufted cell (MC) firing activity under the same conditions. Stim., Stimulus; Rec., recording; STD, standard conditions. B, Effects of local application of SR95531 in the GL. Left diagram, Experimental scheme. Middle plot, LFP recordings under different pharmacological conditions. Note the absence of changes in LFP oscillations during SR95531 application. Right plot, PSTH of the mitral/tufted cells firing activity under the same conditions. C, Average of seven experiments showing the evolution of LFP oscillations over time. Note the reduction of oscillations under SR95531 (SR) applications in the EPL and the absence of effect after applications in the other layers. Kyn, Kynurenic acid. D, Average of seven experiments showing the evolution of mitral/tufted cells discharge over time. Note the increase of the discharge after application in the EPL and the slight increase after application in the GL without modification of the baseline line. The dashed line represents the mean induced firing rate in control conditions.
Figure 7.
Figure 7.
Dendrodendritic reciprocal synapses between GCs and mitral/tufted cells are sufficient to generate γ field oscillations. A, Photomicrograph showing Nissl staining (0.5% cresyl violet) of an OB slice. The recording configuration and the cut position (dashed box) are also indicated. Stim., Stimulus. Scale bar, 200 μm. B, The olfactory nerve stimulation (star, stimulation onset) induced LFP oscillations in both MCL (top trace) and GCL (bottom trace) before (Ctrl, left plot) and after (Cut, right plot) cutting the slice. C, PSTH of the MCL units computed before (left) and after (right) the cut. D, FFTs of the recorded signals before and after the cut. E, Cross-correlations of the signals recorded in the GCL and MCL locations before and after the cut (top, bottom graphs, respectively). F, Average of six experiments showing the effect of the cut on LFP oscillations quantified by the maximal amplitude of FFTs. Note the almost complete disappearance of oscillations in the GCL but not those from the border of the MCL. G, Effect of cutting on the correlation between the two recording sites. After the cut, the correlation remains similar before (Basal) and after (Ind.) the stimulation. H, Absence of effect of cutting on the basal and induced (Ind.) mitral/tufted cells discharges.

References

    1. Adrian ED (1942) Olfactory reactions in the brain of the hedgehog. J Physiol (Lond) 100: 459–473. - PMC - PubMed
    1. Altman J (1969) Autoradiographic and histological studies of postnatal neurogenesis. IV. Cell proliferation and migration in the anterior forebrain, with special reference to persisting neurogenesis in the olfactory bulb. J Comp Neurol 137: 433–457. - PubMed
    1. Bazhenov M, Stopfer M, Rabinovich M, Huerta R, Abarbanel HD, Sejnowski TJ, Laurent G (2001a) Model of transient oscillatory synchronization in the locust antennal lobe. Neuron 30: 553–567. - PMC - PubMed
    1. Bazhenov M, Stopfer M, Rabinovich M, Abarbanel HD, Sejnowski TJ, Laurent G (2001b) Model of cellular and network mechanisms for odor-evoked temporal patterning in the locust antennal lobe. Neuron 30: 569–581. - PMC - PubMed
    1. Becker CJ, Freeman WJ (1968) Prepyriform electrical activity after loss of peripheral or central input, or both. Physiol Behav 3: 597–599.

Publication types

MeSH terms

LinkOut - more resources