. 2004 May 5;24(18):4478-88.
doi: 10.1523/JNEUROSCI.0755-04.2004.

Changes in intracellular chloride after oxygen-glucose deprivation of the adult hippocampal slice: effect of diazepam

Affiliations

Changes in intracellular chloride after oxygen-glucose deprivation of the adult hippocampal slice: effect of diazepam

Francesca Galeffi et al. J Neurosci. .

Abstract

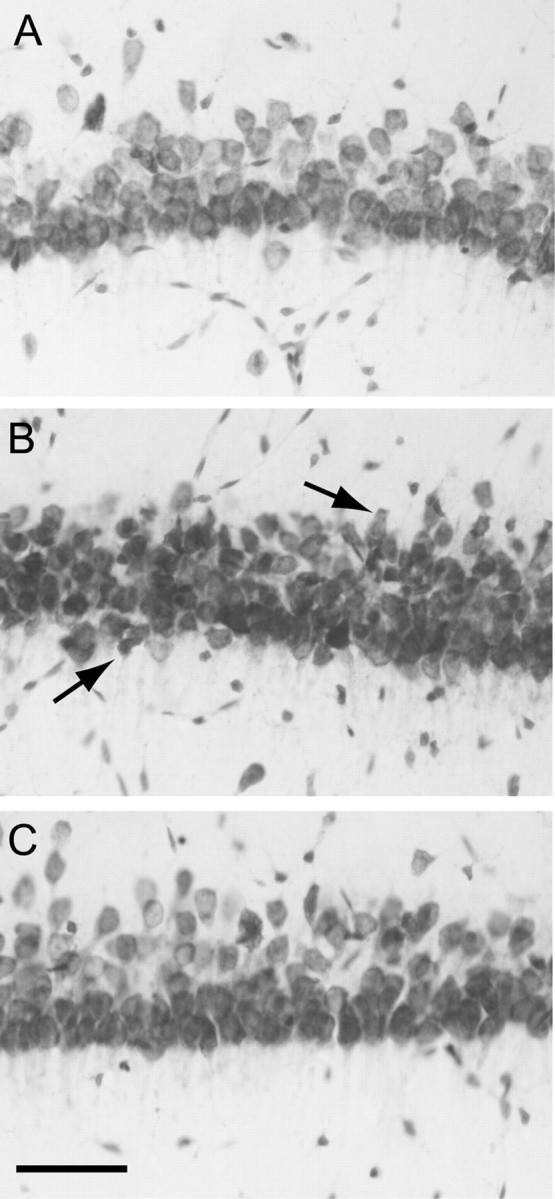
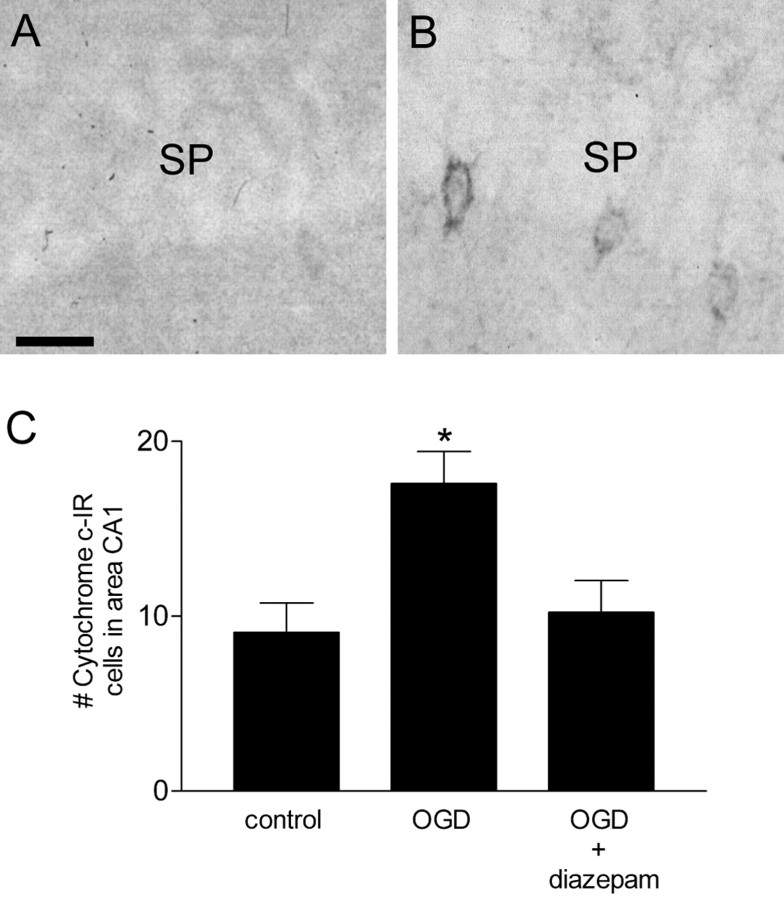
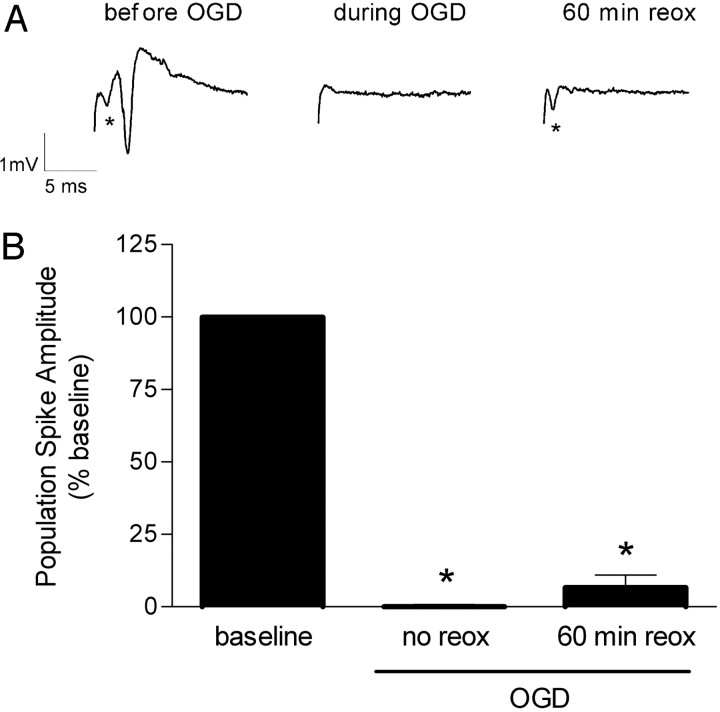
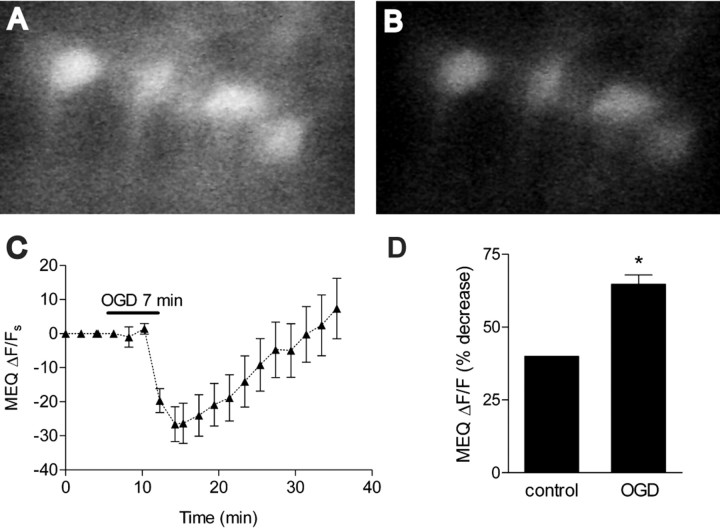
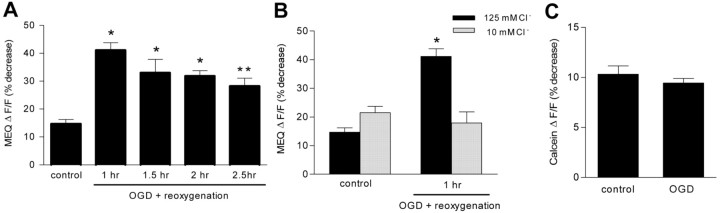
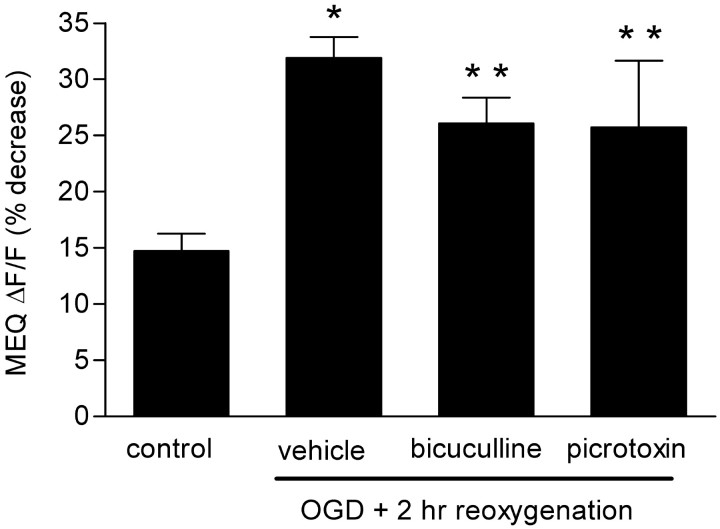
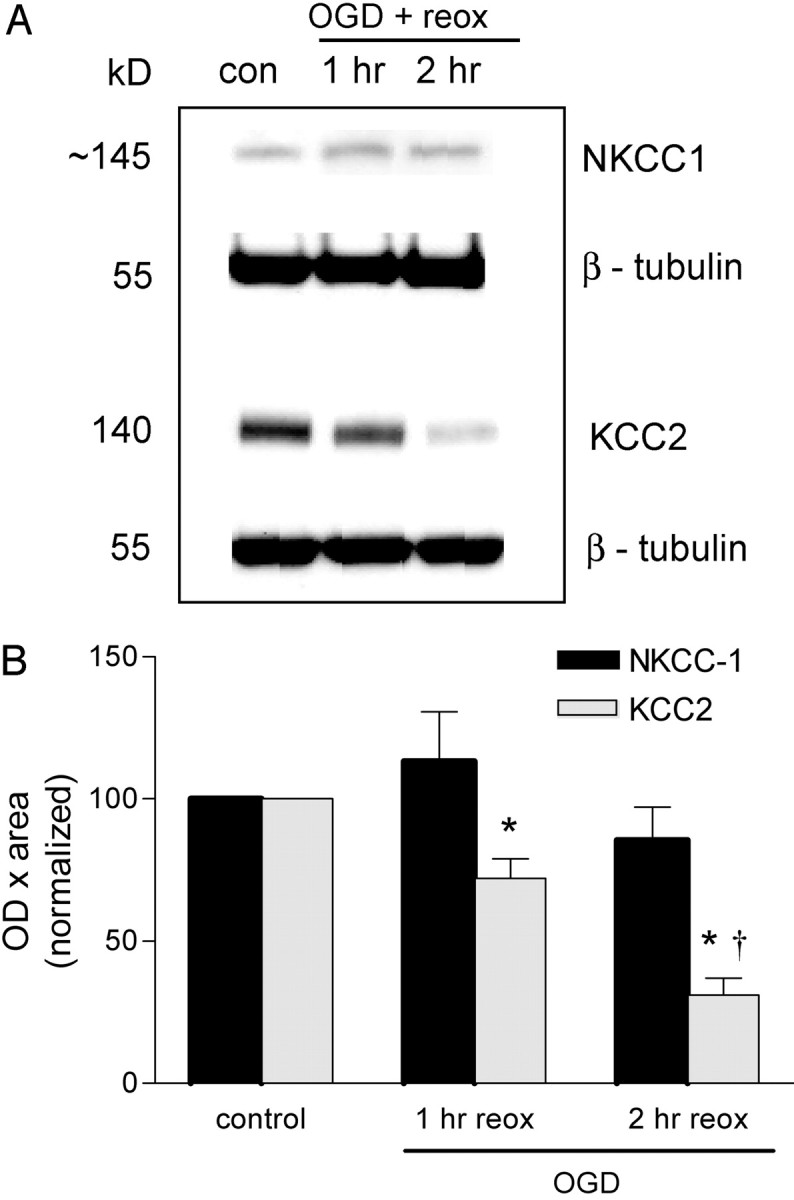
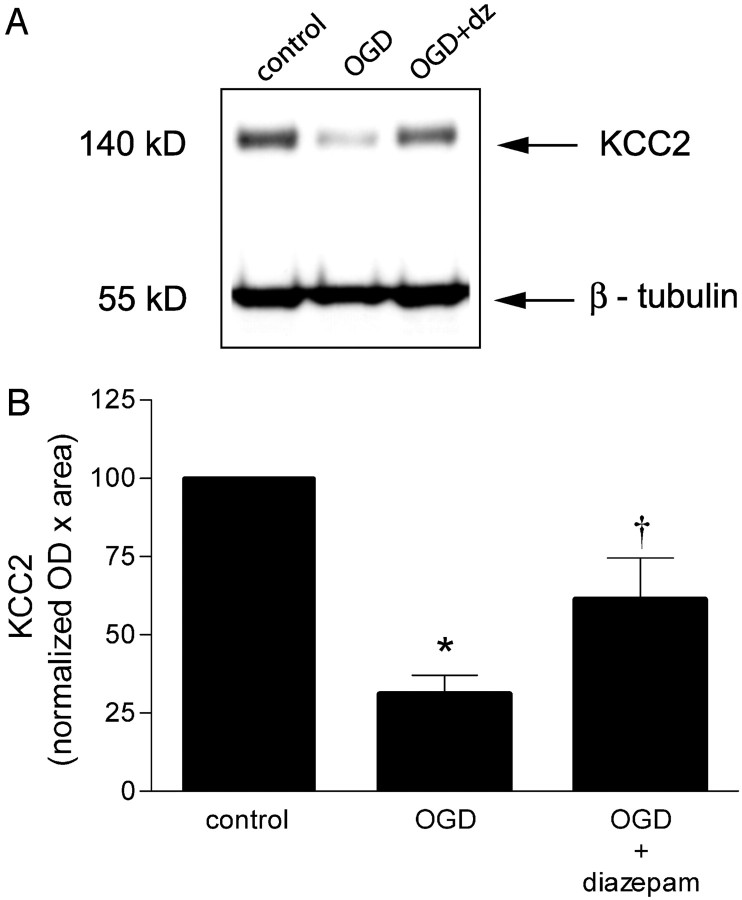
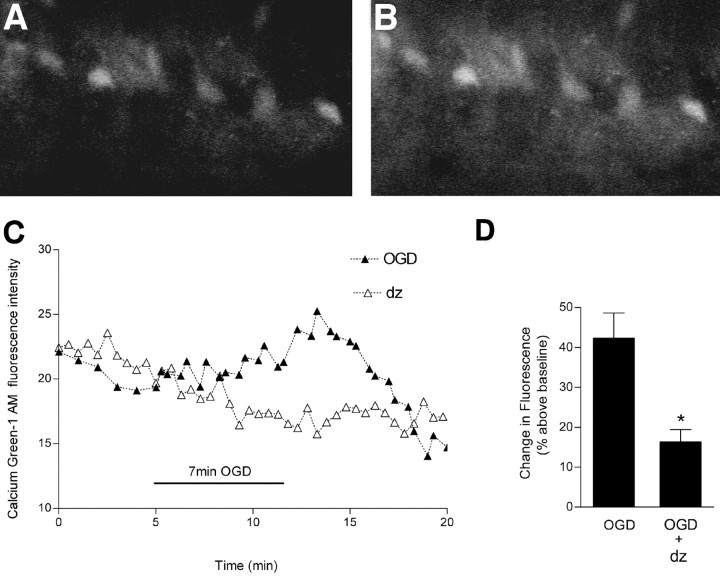
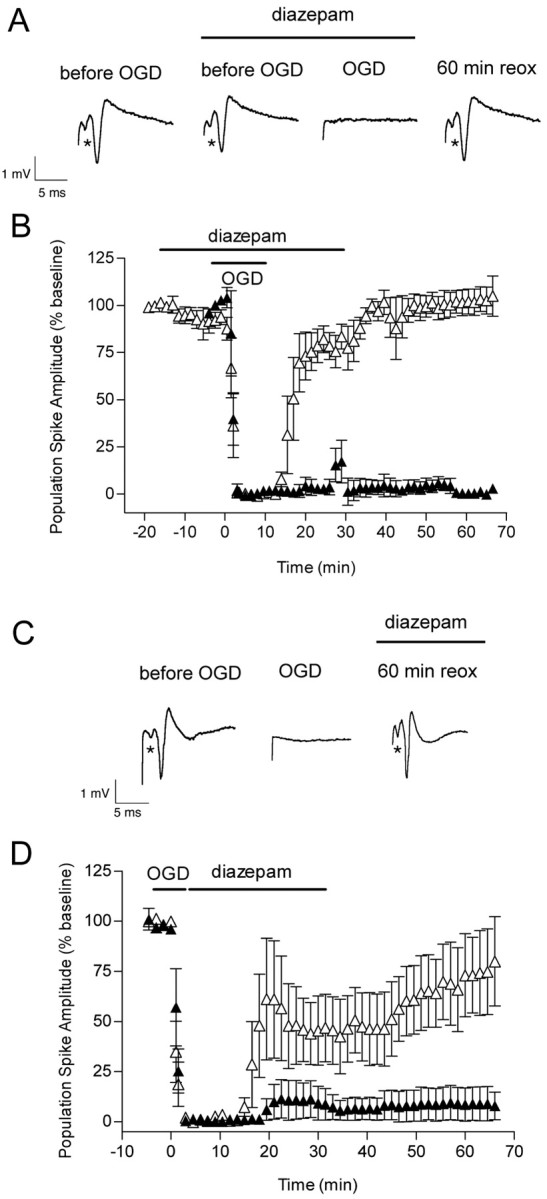
Ischemic injury to the CNS results in loss of ionic homeostasis and the development of neuronal death. An increase in intracellular Ca2+ is well established, but there are few studies of changes in intracellular Cl- ([Cl-]i) after ischemia. We used an in vitro model of cerebral ischemia (oxygen-glucose deprivation) to examine changes in [Cl-]i and GABA(A) receptor-mediated responses in hippocampal slices from adult rats. Changes in [Cl-]i were measured in area CA1 pyramidal neurons using optical imaging of 6-methoxy-N-ethylquinolinium chloride, a Cl--sensitive fluorescent indicator. Oxygen-glucose deprivation induced an immediate rise in [Cl-]i, which recovered within 20 min. A second and more prolonged rise in [Cl-]i occurred within the next hour, during which postsynaptic field potentials failed to recover. The sustained increase in [Cl-]i was not blocked by GABA(A) receptor antagonists. However, oxygen-glucose deprivation caused a progressive downregulation of the K+-Cl- cotransporter (KCC2), which may have contributed to the Cl- accumulation. The rise in [Cl-]i was accompanied by an inability of the GABA(A) agonist muscimol to cause Cl- influx. In vivo, diazepam is neuroprotective when given early after ischemia, although the mechanism by which this occurs is not well understood. Here, we added diazepam early after oxygen-glucose deprivation and prevented the downregulation of KCC2 and the accumulation of [Cl-]i. Consequently, both GABA(A) responses and synaptic transmission within the hippocampus were restored. Thus, after oxygen-glucose deprivation, diazepam may decrease neuronal excitability, thereby reducing the energy demands of the neuron. This may prevent the activation of downstream cell death mechanisms and restore Cl- homeostasis and neuronal function


Figures

Figure 1.
Figure 1.
Morphology of area CA1b pyramidal neurons in adult hippocampal slices subjected to OGD (7 min) and reoxygenated for 3 hr. Sections (30 μm) were prepared from hippocampal slices and stained with cresyl violet as described in Materials and Methods. A, control. B, OGD. Note the mild shrinkage of neurons, indicated by arrows (C), OGD plus diazepam (5 μm, added after OGD). Scale bar, 50 μm.
Figure 2.
Figure 2.
Cytochrome c immunostaining in hippocampal area CA1 2 hr after reoxygenation. Sections (30 μm) were prepared from hippocampal slices and subjected to cytochrome c immunohistochemistry as described in Materials and Methods. A, Control slice. B, Slice subjected to OGD. SP, Stratum pyramidale. C, Quantitiation of immunopositive cells in area CA1 of the hippocampus 2 hr after OGD. Diazepam (5 μm) was added immediately after OGD. Data are the means ± SEM number of immunopositive cells counted in area CA1. *p < 0.01 versus control; ANOVA, followed by Tukey's multiple comparison test (n = 6–10 slices). Scale bar, 25 μm.
Figure 3.
Figure 3.
Effect of OGD on the evoked population spike in area CA1 pyramidal cells. A, Representative individual recordings before, during, and 60 min after 7 min OGD in a hippocampal slice from an adult rat. Postsynaptic population spikes were recorded from area CA1 pyramidal cells after stimulation of the Schaffer collaterals. During OGD, the postsynaptic response was abolished. The failure of the postsynaptic population spike to recover indicates irreversible damage. The presynaptic fiber volley is indicated with an asterisk. B, Data summary. The baseline values consisted of the average of 10 consecutive recordings before OGD, and the 60 min values consisted of the average of five consecutive recordings. The percentage recovery was calculated as the 60 min values/baseline values × 100. Data are the mean ± SEM of nine slices. *p < 0.001 versus baseline; ANOVA and Tukey's multiple comparison test.
Figure 4.
Figure 4.
Effect of OGD on MEQ fluorescence (intracellular Cl) in are a CA1b pyramidal cells. A, B, Confocal video images of MEQ fluorescence in adult hippocampal neurons in area CA1b stratum pyramidale. Special conditions were required to bath-load adult slices successfully with dihydro-MEQ (see Materials and Methods). MEQ fluorescence before (A) and after (B) OGD, at the onset of reoxygenation. C, Continuous recording of the change in MEQ fluorescence within individual CA1 pyramidal neurons before, during, and immediately after OGD. The temperature was maintained at 36°C. The bar indicates the 7 min OGD period. The original ΔF/F values were corrected for baseline by subtracting extrapolated values from the baseline drift of each cell (before OGD) to give the ΔF/F values. D, The peak change in MEQ fluorescence 10 min after the onset of OGD was compared with the fluorescence change in control slices not subjected to OGD over a 10 min recording period. Values are expressed as the percentage decrease in fluorescence during 10 min from the baseline [(ΔF/F) × 100]. Data are the means ± SEM of three to seven cells per condition, respectively. *p < 0.01 versus control; unpaired Student's t test.
Figure 5.
Figure 5.
OGD causes a secondary rise in intracellular Cl that is independent of cell swelling. A, Slices were subjected to OGD, loaded with dihydro-MEQ, and imaged for 10 min at various times during reoxygenation. Values are expressed as the percentage decrease in fluorescence during 10 min from baseline [(ΔF/F) × 100]. Data are the means ± SEM of 29, 9, 6, and 21 cells per condition, respectively. *p < 0.001, **p < 0.01 versus control. B, Slices were superfused with a low-Cl-containing buffer before imaging at 1 hr after OGD. Data are the means ± SEM of 29, 11, 9, and 4 cells percondition, respectively. *p < 0.001 versus control. C, Slices were imaged at 2 hr after OGD for changes in calcein fluorescence under identical conditions as for MEQ. Values are expressed as the percentage decrease in calcein fluorescence during 10 min from baseline [(ΔF/F) × 100]. Data are the means ± SEM of 14 and 16 cells per condition, respectively. p > 0.05 versus control, NS. All statistical procedures included ANOVA and Tukey's multiple comparison test.
Figure 6.
Figure 6.
GABAA antagonists do not prevent Cl accumulation after OGD. Bicuculline (30 μm) or picrotoxin (100 μm) was added to the superfusate during the imaging, 2 hr after reoxygenation. Values are expressed as the percentage decrease in MEQ fluorescence during 10 min from the baseline [(ΔF/F) × 100]. Data are the means ± SEM of 29, 19, 8, and 11 cells per condition, respectively. *p < 0.001, **p < 0.05 versus control; ANOVA and Tukey's multiple comparison test.
Figure 7.
Figure 7.
Effect of OGD on NKCC-1 and KCC2 cotransporter expression in the hippocampus. The hippocampus was dissected from hippocampal slices subjected to OGD and reoxygenated (plus glucose) for 1–2 hr. Samples were prepared for immunoblotting as described in Materials and Methods. A, Representative immunoblots for NKCC1 and KCC2 expression at 1 and 2 hr after OGD. B, Quantitated data from all experiments. Data are the means ± SEM of OD × area digitized normalized to 100. *p < 0.05 versus control; †p < 0.001 versus OGD plus 1 hr of reoxygenation (reox); ANOVA and Tukey's multiple comparison test (n = 4–10 slices for NKCC1 and n = 6–18 slices for KCC2).
Figure 8.
Figure 8.
Diazepam attenuates OGD-induced downregulation of KCC2 protein expression. A, Immunodetection of KKC2 protein expression in hippocampal slices. Slices were exposed to diazepam (dz) during reoxygenation and collected 2 hr after OGD. B, Quantification of the immunoblots by densitometry, as described in Materials and Methods. Data are the means ± SEM of 8, 14, and 20 slices per condition, expressed as normalized OD × area. *p < 0.001 versus control; †p < 0.01 versus OGD; ANOVA and Tukey's multiple comparison test.
Figure 9.
Figure 9.
Effect of diazepam on OGD-induced changes in intracellular Ca2+. Slices were loaded with Calcium Green-1 AM and subjected to OGD for 7 min. A, Video image of area CA1 pyramidal cells shows Calcium Green-1 fluorescence during baseline recording. B, An increase in fluorescence is indicated after OGD. C, Continuous recording of Calcium Green-1 fluorescence before, during, and after OGD in representative slices. In these experiments, diazepam (5 μm) was added to the superfusion buffer at the onset of OGD to affect the immediate rise in intracellular Ca2+. D, The peak increase in intracellular Ca2+ occurred ∼10 min after the onset of OGD. Values are expressed as the percentage increase in fluorescence intensity [(ΔF/F) × 100] of Calcium Green-1 above baseline. Data are the means ± SEM of six and five cells per condition, respectively. *p < 0.01 versus OGD; unpaired Student's t test.
Figure 10.
Figure 10.
Effect of OGD and diazepam (applied before and after OGD) on the evoked population spike in area CA1 pyramidal cells. A, Diazepam (5 μm) was added 15 min before OGD, and it was removed from the slice chamber 30 min after OGD. Representative traces are shown before, during, and 60 min after OGD in the presence of diazepam. The first trace was recorded before the addition of diazepam. B, The time course is shown for changes in the population spike amplitude recorded from pyramidal CA1 neurons in the absence (▴) and in the presence (▵) of diazepam in control and OGD slices. Note the small decrease in population spike amplitude (p < 0.05) starting at –12 min because of the presence of diazepam. To reduce crowding of data points, each data point is the average of three consecutive recordings that were made every 30 sec. Data are the means ± SEM of four slices per condition. C, Diazepam (5 μm) was added immediately after OGD, and it was removed from the slice chamber 30 min later. Individual recordings are shown for a control hippocampal slice before, during, and 60 min after 7 min OGD plus diazepam. D, The time course is shown for changes in the population spike amplitude recorded from pyramidal CA1 neurons in the absence (▴) and in the presence (▵) of diazepam in control and OGD slices. Each data point is the average of three consecutive recordings that were made every 30 sec. Data are the means ± SEM of five slices per condition. The recovery of the population spike amplitude by 60 min of reoxygenation was not different from baseline (p > 0.05; ANOVA and Tukey's multiple comparison test).

References

    1. Abramowicz EA, Kass IS, Chambers G, Cottrell E (1991) Midazolam improves electrophysiologic recovery after anoxia and reduces changes in ATP levels and calcium influx during anoxia in the rat hippocampal slice. Anesthesiology 74: 1121–1123. - PubMed
    1. Balestrino M, Aitken PG, Somjen GG (1989) Spreading depression-like depolarization in CA1 and fascia dentata of hippocampal slices: relationship to selective vulnerability. Brain Res 497: 102–107. - PubMed
    1. Beck J, Lenart B, Kintner DB, Sun D (2003) Na–K–Cl cotransporter contributes to glutamate-mediated excitotoxicity. J Neurosci 23: 5061–5068. - PMC - PubMed
    1. Crowe WE, Altamirano J, Huerto L, Alvarez-Leefmans FG (1995) Volume changes in single NIE-115 neuroblastoma cells measured with a fluorescent probe. Neuroscience 69: 283–296. - PubMed
    1. DeFazio RA, Keros S, Quick MW, Hablitz JJ (2000) Potassium-coupled chloride cotransport controls intracellular chloride in rat neocortical pyramidal neurons. J Neurosci 20: 8069–8076. - PMC - PubMed

Publication types

MeSH terms

LinkOut - more resources