Review
. 2002;1(3):111-9.

Consensus sequence Zen

Affiliations
Review

Consensus sequence Zen

Thomas D Schneider. Appl Bioinformatics. 2002.

Abstract

Consensus sequences are widely used in molecular biology but they have many flaws. As a result, binding sites of proteins and other molecules are missed during studies of genetic sequences and important biological effects cannot be seen. Information theory provides a mathematically robust way to avoid consensus sequences. Instead of using consensus sequences, sequence conservation can be quantitatively presented in bits of information by using sequence logo graphics to represent the average of a set of sites, and sequence walker graphics to represent individual sites.


Figures

Figure 1
Figure 1
Sequence logos (Schneider & Stephens, 1990) for human donor and acceptor splice junctions (Stephens & Schneider, 1992) compared to the consensus sequence for both sites. Source: Adapted from (Stephens & Schneider, 1992).
Figure 2
Figure 2
Sequence walkers (Schneider, 1997b) for a human acceptor site in the iduronidase synthetase gene and a mutation (indicated by an arrow). On the top sequence, the normal end of exon 4 is shown by a bracket and dashed line. The vertical rectangle on a sequence walker is the ‘zero base’ used to identify the location of the walker. The vertical rectangles also indicate a scale from -3 to +2 bits. A 12.7 bit acceptor at 5154 directs splicing to the correct location. Source: Adapted from (Rogan et al., 1998).
Figure 3
Figure 3
Sequence logo for random sequences. Error bars, shown by I beams, indicate one standard deviation of the stack height. Note that a small-sample correction (Schneider et al., 1986) suppresses the stack height so that a position such as -19, which is 50% C and 50% G, is lower than 1 bit. The correction is needed to counter a statistical bias that causes an apparent information to appear when one substitutes frequencies for probabilities in Shannon’s equation (Schneider et al., 1986; Miller, 1955; Basharin, 1959). The same effect makes one tend to see patterns where there are none. The consensus sequence on the bottom was chosen from positions that have 50% or more of one base. S is the two-letter code for C or G.
Figure 4
Figure 4
Region upstream of the tgt/sec promoter of E. coli analyzed by Fis sequence walkers. The information for each Fis site was computed from models that are 21 bases wide (-10 to +10) but only the range -7 to +7 is shown by walkers. The sine waves represent major (peaks) and minor (valley) grooves faced by the Fis protein. Source: Adapted from (Schneider, 1997b).
Figure 5
Figure 5
Sequence logo for RepA binding sites. Error bars indicate standard deviations of the entire stack height. Source: Adapted from (Schneider, 2001).
Figure 6
Figure 6
Sequence logo for the -10 region of E. coli promoters. The promoters were from the Lisser-Margalit database (Lisser & Margalit, 1993). The dashed and solid boxes show the regions opened by the polymerase, while the arrow shows the start points of transcription. Source: Adapted from (Schneider, 2001).
Figure 7
Figure 7
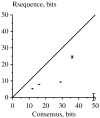
Consensus versus Rsequence. The information for the 5 sequence logos in figures 1, 3, 5, and 6 was graphed by comparing the information content (Rsequence) to the information content of the corresponding consensus sequence. Rsequence is the average information in a set of binding sites. It is also the summed area under the sequence logo. The line at 45° represents equality between the two measures. The data are summarized in Table 1.

References

    1. Abeles AL. P1 plasmid replication. Purification and DNA-binding activity of the replication protein RepA. J. Biol. Chem. 1986;261:3548–3555. - PubMed
    1. Abeles AL, Reaves LD, Austin SJ. Protein-DNA interactions in regulation of P1 plasmid replication. J. Bacteriol. 1989;171:43–52. - PMC - PubMed
    1. Barrett M, Donoghue MJ, Sober E. Against Consensus. Syst. Zool. 1991;40:486–493.
    1. Barrett M, Donoghue MJ, Sober E. Crusade? A Reply to Nelson. Syst. Biol. 1993;42:216–217.
    1. Basharin GP. On a statistical estimate for the entropy of a sequence of independent random variables. Theory Probability Appl. 1959;4(3):333–336.

LinkOut - more resources