Comparative Study
. 2004 May;42(5):1994-9.
doi: 10.1128/JCM.42.5.1994-1999.2004.

Reverse transcriptase PCR diagnostic assay for the coronavirus associated with severe acute respiratory syndrome

Affiliations
Comparative Study

Reverse transcriptase PCR diagnostic assay for the coronavirus associated with severe acute respiratory syndrome

Raymond K H Hui et al. J Clin Microbiol. 2004 May.

Abstract

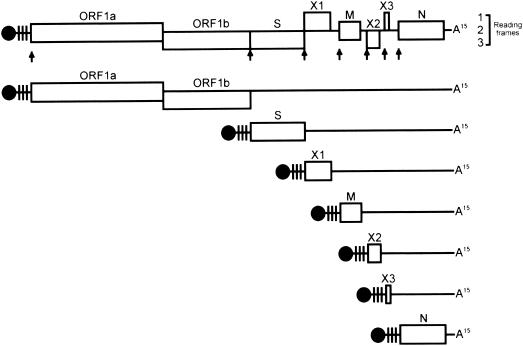
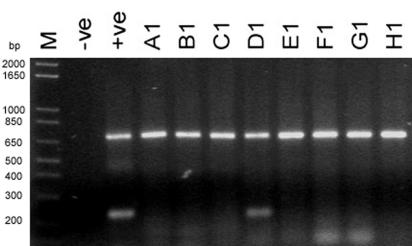
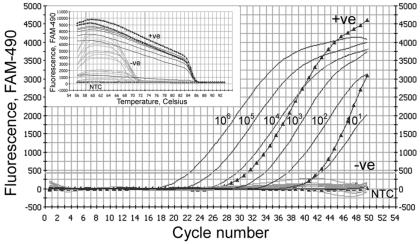
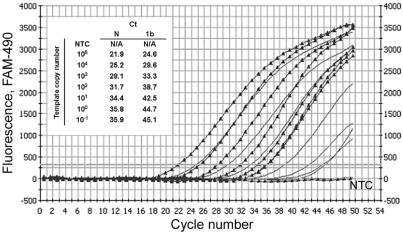
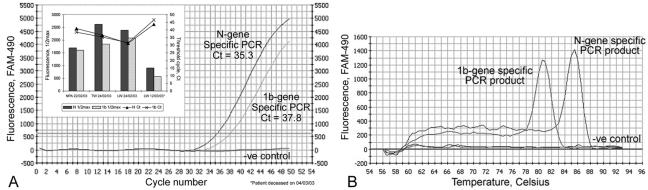
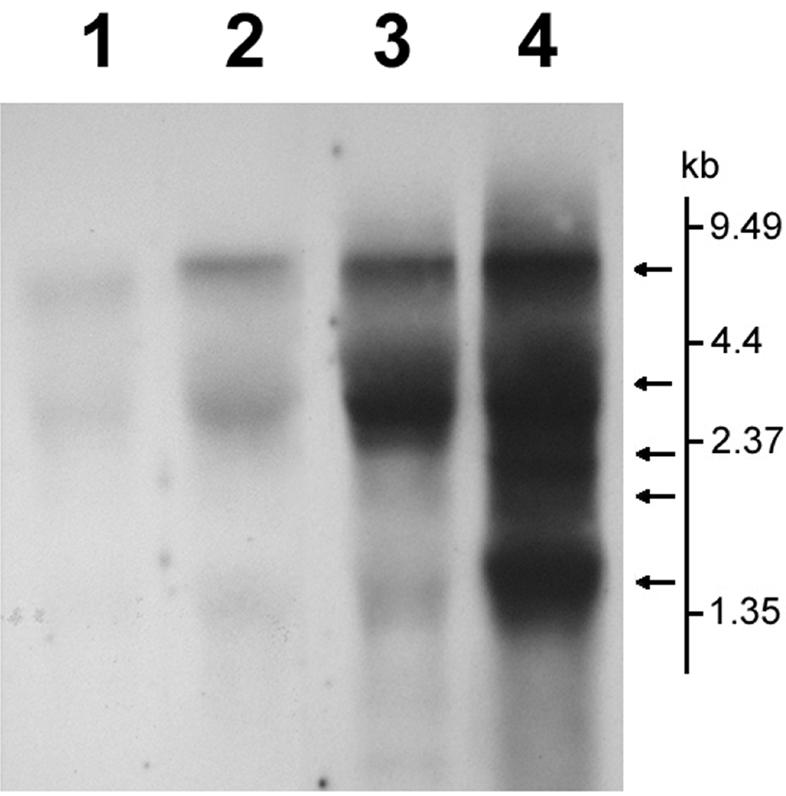
Recent outbreaks of severe acute respiratory syndrome (SARS) have spurred intense research efforts around the world to deal with the serious threat to health posed by this novel coronavirus. A rapid, reliable diagnostic assay is needed for monitoring the spread of the disease. Here we report a method for eliminating false-negative results and increasing test sensitivity, based on the hypothesis that the message encoded by the nucleocapsid (N) gene is the most abundant during viral infection. Nasopharyngeal aspirates and stool samples were obtained from suspected SARS patients with major clinical symptoms and a significant history of close contact with infected patients. Total RNAs were extracted in a 96-well format, together with pig kidney epithelial (PK-15) cells as an internal control for extraction efficiency. PCR inhibitors were removed by ethanol precipitation, and a PCR for the pig beta-actin gene was used as a positive control for all clinical samples. Samples were analyzed by a reverse transcriptase PCR assay. Northern blot analysis was performed to demonstrate differences in subgenomic transcripts of the virus, and a real-time quantitative PCR was employed to compare the sensitivities of two loci (1b and N). The detection rate of the assay reached 44.4% on day 9 after the onset of the disease. The diagnostic PCR amplifying the N gene gave an average of a 26.0% (6.3 to 60.0%) stronger intensity signal than that for the 1b gene. In conclusion, the nucleocapsid gene represents an additional sensitive molecular marker for the diagnosis of the SARS coronavirus and can be further adapted for use in a high-throughput platform assay.


Figures

FIG. 1.
FIG. 1.
Genome organization and transcription strategy of SARS-CoV HK-39. Genomic and mRNA transcripts are capped (black circles), carry leader sequences (vertical lines) at the 5′-proximal end, and are polyadenylated (A15). Arrows point to the positions of the intergenic sequence (CTAAACGAAC). After the release of the positive-sense genomic RNA into the cytoplasm of the host cell, the viral RNA-dependent RNA polymerase, encoded by ORF1a and -1b, is synthesized. It performs transcription of a full-length complementary (negative-sense) RNA, from which new genomic RNA, an overlapping set of subgenomic mRNA transcripts, and leader RNAs are synthesized. Note that all transcripts are preceded with common 5′ leader sequences and common 3′ ends. ORF1a and -1b, RNA-dependent RNA polymerase; S, the major peplomer glycoprotein; M, transmembrane glycoprotein; N, nucleocapsid protein; X1, X2, and X3, putative uncharacterized proteins.
FIG. 2.
FIG. 2.
RT-PCR screening of clinical samples from suspected SARS patients. The upper bands in each row show a 745-bp DNA fragment amplified with actin F and actin R, while the lower bands are the amplicons by primers specific to the N gene of SARS-CoV (225 bp). cDNA samples synthesized from total RNAs extracted from NPA samples (A1 to H1) were used as templates in both N-gene-specific and β-actin-specific PCRs. The negative control (water) and positive control (cDNA from SARS-CoV-infected Vero cells) for the assay are indicated. Five-microliter samples of PCR products from two separate reactions, i.e., N-gene-specific PCR and β-actin-specific PCR, were mixed and loaded into the same well in a 2% agarose gel. M, 1 kb Plus molecular marker (Invitrogen).
FIG. 3.
FIG. 3.
Specificity test for N-gene-specific PCR. An amplification plot of fluorescence intensity versus the number of PCR cycles is shown. Black lines show the dynamic range of N-gene-specific PCR with a serially diluted plasmid construct (from 101 to 106 copies). Results for NPA samples from non-SARS patients, including patients suffering from infections with adenovirus (n = 5), respiratory syncytial virus (n = 5), human metapneumovirus (n = 5), influenza A virus (n = 5), or influenza B virus (n = 5), are shown by gray lines. Triangles, SARS-CoV-positive NPA samples. NTC, no-template control. The x axis indicates the cycle number of the quantitative PCR, while the y axis represents the fluorescence intensity (FAM-490) over the background signal. The inset shows a melting curve analysis of the PCR products. Signals from positive (+ve) and negative (−ve) samples and from a no-template control are indicated.
FIG. 4.
FIG. 4.
Comparison of dynamic ranges of N-gene- and 1b-gene-specific PCRs. The dynamic ranges of both N-gene- and 1b-gene-specific PCRs were obtained with the same plasmid construct into which a 1:1 ratio of the corresponding amplicons were subcloned. The serially diluted plasmid, with copy numbers ranging from 10−1 to 105 copies, was used as a template for both PCRs. Triangles, N-gene-specific PCR; gray lines, 1b-gene-specific PCR. The inset shows CT values for a triplicate set of experiments of both PCRs with different copy numbers of the template. NTC, no-template control. The x axis indicates the cycle number of the quantitative PCR, while the y axis represents the fluorescence.
FIG. 5.
FIG. 5.
Amplification curve (A) and melting curve (B) of real-time quantitative PCR specific to 1b and N gene of SARS CoV. (A) Amplification plot of fluorescence intensity versus the number of PCR cycles. One-microliter samples of cDNAs from NPA, tracheal dispersion, and lung biopsy samples from patients with clinical symptoms were used as templates for PCRs. Fifty cycles of PCR were performed to achieve the saturation phase of the reaction. The x axis indicates the cycle number of the quantitative PCR, while the y axis represents the fluorescence intensity (FAM-490) above the background signal. The horizontal gray line indicates the threshold value calculated by the maximum curvature approach, and the baseline cycle CT was calculated automatically. The inset shows half-maximal fluorescence values (1/2max) and CT values of both PCRs with cDNAs from various tissues isolated from a key patient (patient A [1]) at three different time points. TW, tracheal wash; LW, lung wash. (B) Melting curves of PCR products. Melting curve analysis was performed after a 10-min further extension step. The Tm rose from 56 to 94°C for 76 0.5-s steps, while each set-point temperature was held for 7 s for data collection and analysis. The Tms of the 1b- and N-gene-specific PCR products were 80.5 and 85.5°C, respectively. The x axis indicates the temperature in degrees Celsius, while the y axis represents the fluorescence intensity (FAM-490) above the background signal. One microliter of water was used as a no-template control in the reaction.
FIG. 6.
FIG. 6.
Northern blot analysis of SARS-CoV total RNA. The total RNA of SARS-CoV was extracted from SARS-CoV-infected Vero E6 cells. The RNA was separated in a 1% denaturing gel containing 6.29% formaldehyde. Afterwards, the RNA was transferred to a positively charged nylon membrane and hybridized with digoxigenin-labeled PCR fragments specific for the 1b, S, M, and N genes. Lane 1, 1b; lane 2, S; lane 3, M; lane 4, N. The vertical bar shows the molecular size reference. Arrows indicated the transcripts hybridized with the N probe. The signals were analyzed by chemiluminescence.

References

    1. Drosten, C., S. Günther, W. Presier, S. Werf, H. Brodt, S. Becker, et al. 2003. Identification of a novel coronavirus in patients with severe acute respiratory syndrome. N. Engl. J. Med. 348:1967-1976. - PubMed
    1. Fredricks, D., and D. Relman. 1998. Improved amplification of microbial DNA from blood cultures by removal of the PCR inhibitor sodium polyanetholesulfonate. J. Clin. Microbiol. 36:2810-2816. - PMC - PubMed
    1. Marra, M., S. Jones, C. Astell, R. Holt, A. Brooks-Wilson, et al. 2003. The complete genome sequence of SARS-associated coronavirus. Science 300:1377-1378. - PubMed
    1. Peiris, J., S. Lai, L. Poon, Y. Guan, L. Yam, W. Lim, et al. 2003. Coronavirus as a possible cause of severe acute respiratory syndrome. Lancet 361:1319. - PMC - PubMed
    1. Poon, L., K. Chan, O. Wong, W. Yam, K. Yuen, Y. Guan, D. Lo, and J. Peiris. 2003. Early diagnosis of SARS coronavirus infection by real time RT-PCR. J. Clin. Virol. 28:233-238. - PMC - PubMed

Publication types

MeSH terms

LinkOut - more resources