

Comparison of two real-time quantitative assays for detection of severe acute respiratory syndrome coronavirus
- PMID: 15131175
- PMCID: PMC404649
- DOI: 10.1128/JCM.42.5.2094-2100.2004
Comparison of two real-time quantitative assays for detection of severe acute respiratory syndrome coronavirus
Abstract
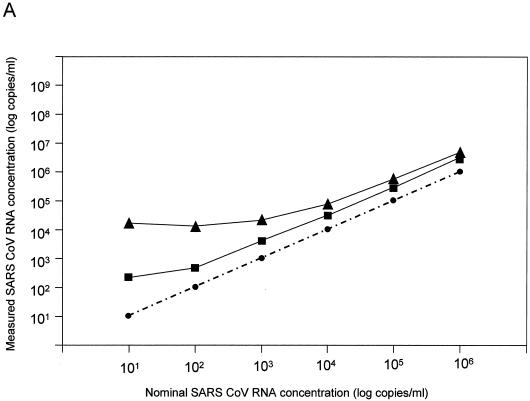
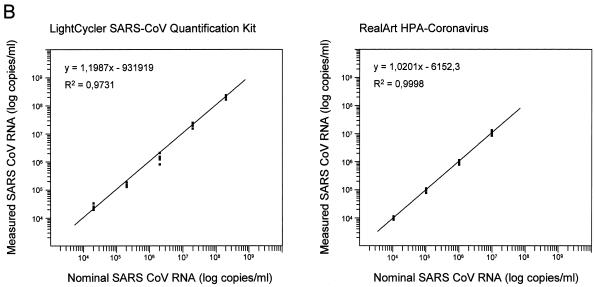
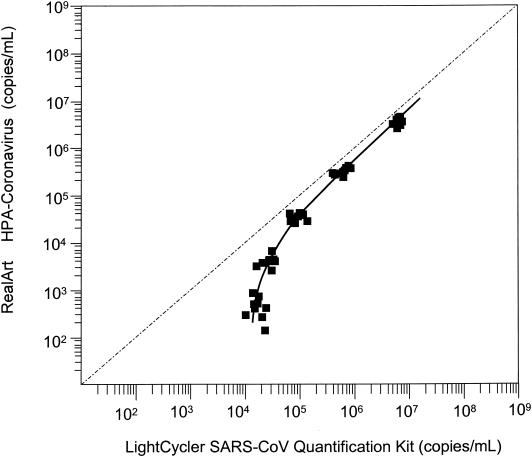
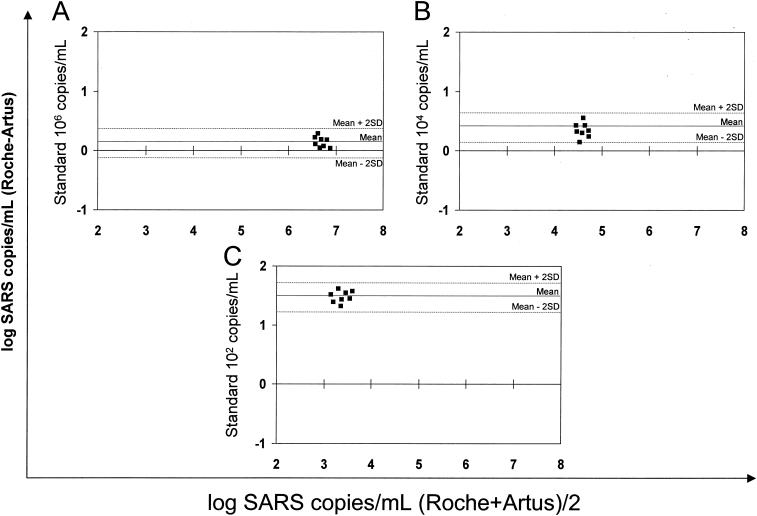
The new severe acute respiratory syndrome (SARS) coronavirus (CoV), described in February 2003, infected a total of 8,439 people. A total of 812 people died due to respiratory insufficiency. Close contact with symptomatic patients appeared to be the main route of transmission. However, potential transmission by blood transfusion could not be definitely excluded. Two real-time SARS-specific PCR assays were assessed for their sensitivities, agreement of test results, and intra-assay variabilities. Both assays rely on reverse transcription and amplification of extracted RNA. Dilutions of gamma-irradiated cell culture supernatants of SARS CoV-infected Vero E6 cells were prepared to determine the precisions, linear ranges, and accuracies of the assays. The linear range for the Artus RealArt HPA-Coronavirus assay (Artus assay) was 1 x 10(2) to 1 x 10(7) copies/ml, and that for the Roche LightCycler SARS CoV Quantification kit (Roche assay) was 1 x 10(4) to 2 x 10(8) copies/ml. The detection limit of the Roche assay was 3,982.1 copies/ml, whereas that of the Artus assay was 37.8 copies/ml. Detection limits were calculated with a standard preparation that was recommended for use by the World Health Organization. However, quantification of CoV in this preparation may be imprecise. In summary, both assays are suitable for quantitative measurement of SARS CoV at the high concentrations expected in sputum samples. The Artus assay is also suitable for detection of SARS CoV at the low concentrations found in serum samples.
Figures
Similar articles
-
Evaluation of advanced reverse transcription-PCR assays and an alternative PCR target region for detection of severe acute respiratory syndrome-associated coronavirus.J Clin Microbiol. 2004 May;42(5):2043-7. doi: 10.1128/JCM.42.5.2043-2047.2004. J Clin Microbiol. 2004. PMID: 15131168 Free PMC article.
-
Performance and Cost evaluation of one commercial and six in-house conventional and real-time reverse transcription-pcr assays for detection of severe acute respiratory syndrome coronavirus.J Clin Microbiol. 2004 Apr;42(4):1471-6. doi: 10.1128/JCM.42.4.1471-1476.2004. J Clin Microbiol. 2004. PMID: 15070991 Free PMC article.
-
Rapid and sensitive detection of multiple genes from the SARS-coronavirus using quantitative RT-PCR with dual systems.J Med Virol. 2005 Oct;77(2):151-8. doi: 10.1002/jmv.20432. J Med Virol. 2005. PMID: 16121372 Free PMC article.
-
[Detection of SARS coronavirus RNA].Nihon Rinsho. 2005 Dec;63 Suppl 12:366-71. Nihon Rinsho. 2005. PMID: 16416820 Review. Japanese. No abstract available.
-
Molecular diagnosis of severe acute respiratory syndrome: the state of the art.J Mol Diagn. 2005 Nov;7(5):551-9. doi: 10.1016/S1525-1578(10)60587-9. J Mol Diagn. 2005. PMID: 16258152 Free PMC article. Review.
Cited by
-
Evaluation of a novel vesicular stomatitis virus pseudotype-based assay for detection of neutralizing antibody responses to SARS-CoV.J Med Virol. 2006 Dec;78(12):1509-12. doi: 10.1002/jmv.20732. J Med Virol. 2006. PMID: 17063504 Free PMC article.
-
SARS-CoV, MERS-CoV and SARS-CoV-2: A Diagnostic Challenge.Measurement (Lond). 2021 Jan 15;168:108335. doi: 10.1016/j.measurement.2020.108335. Epub 2020 Aug 8. Measurement (Lond). 2021. PMID: 33519010 Free PMC article.
-
Sensitive and specific enzyme-linked immunosorbent assay using chemiluminescence for detection of severe acute respiratory syndrome viral infection.J Clin Microbiol. 2008 Jan;46(1):302-10. doi: 10.1128/JCM.01006-07. Epub 2007 Nov 21. J Clin Microbiol. 2008. PMID: 18032623 Free PMC article.
-
Performance of single-step gel-based reverse transcription-PCR (RT-PCR) assays equivalent to that of real-time RT-PCR assays for detection of the severe acute respiratory syndrome-associated coronavirus.J Clin Microbiol. 2005 Aug;43(8):4262-5. doi: 10.1128/JCM.43.8.4262-4265.2005. J Clin Microbiol. 2005. PMID: 16081995 Free PMC article.
-
Development and evaluation of a multitarget real-time Taqman reverse transcription-PCR assay for detection of the severe acute respiratory syndrome-associated coronavirus and surveillance for an apparently related coronavirus found in masked palm civets.J Clin Microbiol. 2005 May;43(5):2041-6. doi: 10.1128/JCM.43.5.2041-2046.2005. J Clin Microbiol. 2005. PMID: 15872219 Free PMC article.
References
-
- Anonymous. 2003. FactSheet: severe acute respiratory syndrome (SARS). N. S. W. Public Health Bull. 14:62. - PubMed
-
- Bland, J. M., and D. G. Altman. 1986. Statistical methods for assessing agreement between two methods of clinical measurement. Lancet 1:307-310. - PubMed
-
- Bustin, S. A. 2000. Absolute quantification of mRNA using real-time reverse transcription polymerase chain reaction assays. J. Mol. Endocrinol. 25:169-193. - PubMed
Publication types
MeSH terms
Substances
LinkOut - more resources
Full Text Sources
Miscellaneous
