. 2004 Jul 15;558(Pt 2):433-49.
doi: 10.1113/jphysiol.2004.061184. Epub 2004 May 7.

Exposure to cAMP and beta-adrenergic stimulation recruits Ca(V)3 T-type channels in rat chromaffin cells through Epac cAMP-receptor proteins

Affiliations

Exposure to cAMP and beta-adrenergic stimulation recruits Ca(V)3 T-type channels in rat chromaffin cells through Epac cAMP-receptor proteins

M Novara et al. J Physiol. .

Abstract

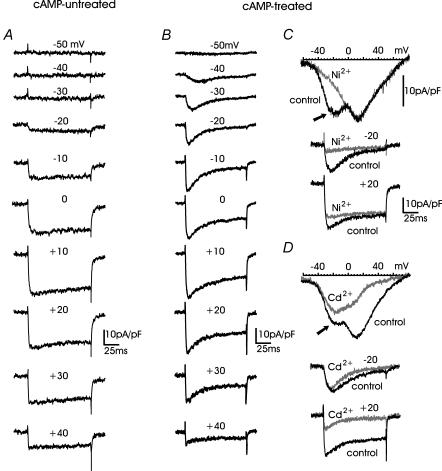
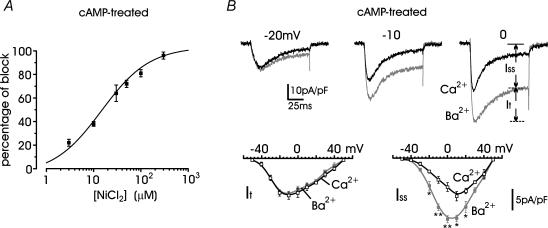
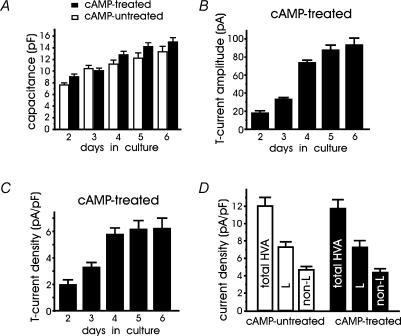
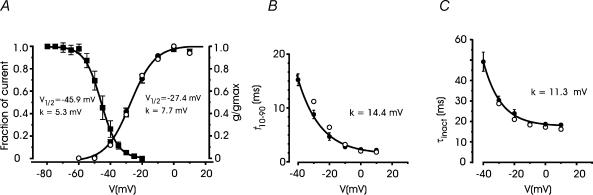
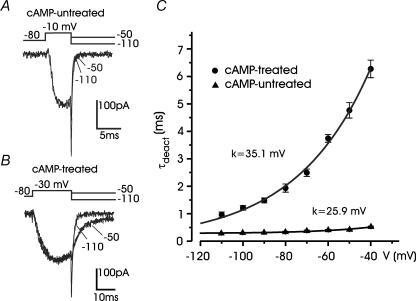
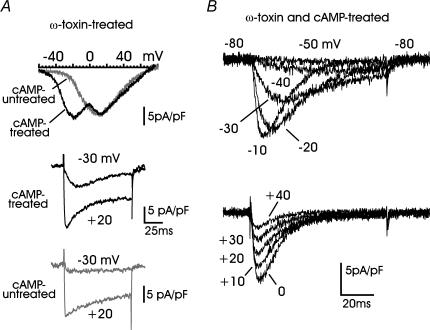
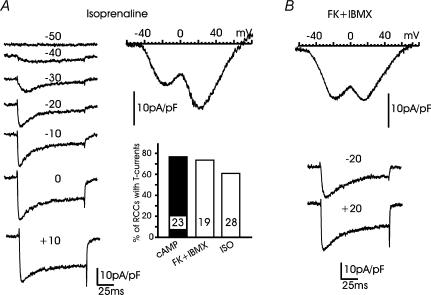
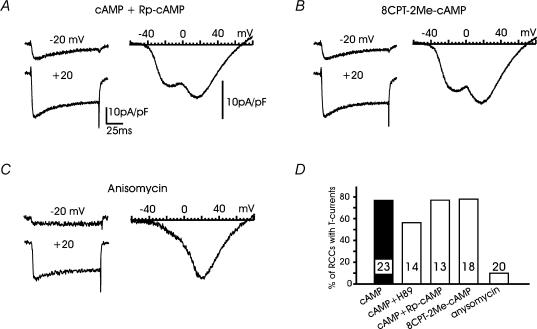
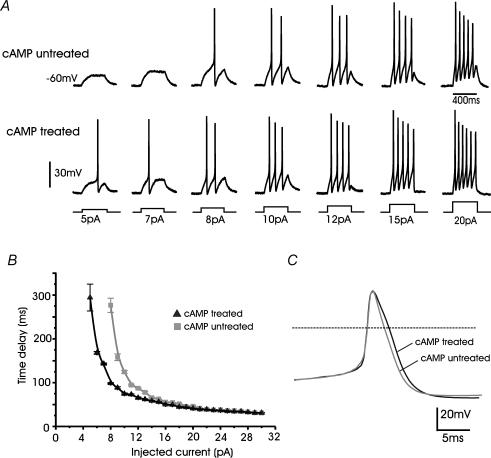
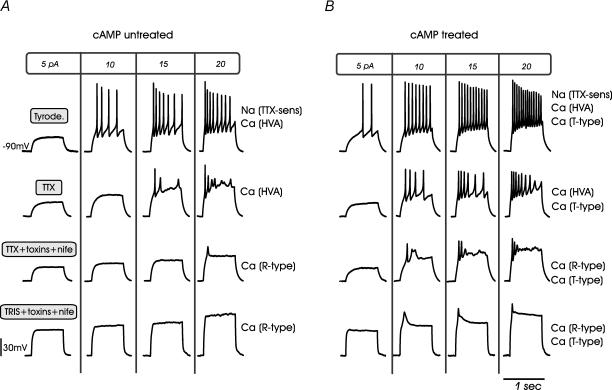
T-type channels are expressed weakly or not at all in adult rat chromaffin cells (RCCs) and there is contrasting evidence as to whether they play a functional role in catecholamine secretion. Here we show that 3-5 days after application of pCPT-cAMP, most RCCs grown in serum-free medium expressed a high density of low-voltage-activated T-type channels without altering the expression and characteristics of high-voltage-activated channels. The density of cAMP-recruited T-type channels increased with time and displayed the typical biophysical and pharmacological properties of low-voltage-activated Ca(2+) channels: (1) steep voltage-dependent activation from -50 mV in 10 mm Ca(2+), (2) slow deactivation but fast and complete inactivation, (3) full inactivation following short conditioning prepulses to -30 mV, (4) effective block of Ca(2+) influx with 50 microM Ni(2+), (5) comparable permeability to Ca(2+) and Ba(2+), and (6) insensitivity to common Ca(2+) channel antagonists. The action of exogenous pCPT-cAMP (200 microM) was prevented by the protein synthesis inhibitor anisomycin and mimicked in most cells by exposure to forskolin and 1-methyl-3-isobutylxanthine (IBMX) or isoprenaline. The protein kinase A (PKA) inhibitor H89 (0.3 microM) and the competitive antagonist of cAMP binding to PKA, Rp-cAMPS, had weak or no effect on the action of pCPT-cAMP. In line with this, the selective Epac agonist 8CPT-2Me-cAMP nicely mimicked the action of pCPT-cAMP and isoprenaline, suggesting the existence of a dominant Epac-dependent recruitment of T-type channels in RCCs that may originate from the activation of beta-adrenoceptors. Stimulation of beta-adrenoceptors occurs autocrinally in RCCs and thus, the neosynthesis of low-voltage-activated channels may represent a new form of 'chromaffin cell plasticity', which contributes, by lowering the threshold of action potential firing, to increasing cell excitability and secretory activity during sustained sympathetic stimulation and/or increased catecholamine circulation.


Figures

Figure 1
Figure 1. Time course of Ca2+ currents in cAMP-treated and cAMP-untreated RCCs: distinct blocking action of Ni2+ and Cd2+
A, Ca2+ currents recorded during consecutive step depolarizations at the indicated voltages from a 4 day RCC cultured in the absence of pCPT-cAMP. Holding potential (Vh) and return potential (Vr) were −80 mV. B, same recording conditions as in A from a 5 day RCC exposed since the 1st day of culture to 200 μm pCPT-cAMP. C, 50 μm Ni2+ blocked the ‘low-threshold shoulder’ of the IV curve (arrow) and the currents recorded at −20 and +20 mV (grey traces). Ni2+-insensitive currents were no longer fast inactivating. D, addition of 30 μm Cd2+ blocked the high-threshold component of the IV curve and the stationary currents recorded during step depolarizations. Cd2+-insensitive currents were fast, fully inactivating and preserved the ‘low-threshold shoulder’ of the IV curve (arrow). Same conditions and scale bars as in C.
Figure 2
Figure 2. The transient current component of cAMP-treated RCCs is blocked by low doses of Ni2+ and is carried equally by Ca2+ and Ba2+
A, dose–response relationship of Ni2+ block of the transient current component. Percentage of block was measured at either −30 or −20 mV and calculated from n = 5–10 values for each concentration. The smooth curve represents the fit to the data with IC50 = 16.1 ± 3.1 μm and Hill slope 0.72 ± 0.11. B: upper traces, Ca2+ (black traces) and Ba2+ currents (grey traces) recorded at the potentials indicated from the same cAMP-treated RCC; lower traces, IV relationships for the transient (It) and steady-state component (Iss) of Ca2+ and Ba2+ currents evaluated at the end of a pulse, as indicated in the top panel. Step depolarizations of 10 mV increments starting from −50 mV were applied from a −80 mV holding potential. *P < 0.05 and **P < 0.01.
Figure 3
Figure 3. Cell capacitance and T-type current density increase with time in culture
A, in cAMP-untreated (open columns) and cAMP-treated RCCs (filled columns) the mean membrane capacitance increased equally with time in culture. The large number of RCCs used (39 < n < 56 and 12 < n < 24 for cAMP-untreated and cAMP-treated cells, respectively) were selected randomly with no specific bias toward their size. B, mean T-type current amplitudes measured at −30 mV in RCCs exposed to pCPT-cAMP during the 1st day of culture. Notice the saturating size after the 5th day in culture (4th day after cAMP application). C, mean T-type current densities (in pA pF−1) obtained by dividing the values of panel B by the values of panel A. D, mean current densities of total HVA, L- and non-L-type currents in cAMP-untreated (open columns, n = 23 cells) and cAMP-treated cells (filled columns, n = 14 cells). Current amplitudes were estimated from RCCs cultured for 5 days during step depolarizations to +10 mV from Vh = −40 mV to avoid contamination of T-type currents. The amplitude of L- and non-L-type currents was estimated by using 1 μm nifedipine (see text).
Figure 4
Figure 4. Activation and inactivation characteristics of cAMP-recruited T-type currents
A, steady-state inactivation and voltage dependent conductance of T-type currents. The inactivation curve (▪) was obtained from n = 8 cAMP-treated cells using an inactivating prepulse of 500 ms (Vp) varying from −80 to −20 mV with 5 mV step increments. Test potential was to −30 mV. The continuous curve is a Boltzmann function best fitting the data points with V1/2 and k as indicated. The normalized Ca2+ channel conductance (•) was calculated as Ipeak/(VVrev) with Vrev = +55 mV from n = 8 cAMP-treated RCCs corrected for Ni2+-insensitive currents. •, data taken from the recordings of Fig. 6B. The continuous curve is a Boltzmann function with V1/2 and k as indicated. B and C, voltage dependence of activation and inactivation. The former was measured as the time taken to rise from 10% to 90% of peak current (t10–90), the latter by the inactivation time constant (τinact) calculated by fitting the decaying part of the currents with a single exponential, after Ni2+ correction, from n = 8 cAMP-treated cells (•). Smooth curves are single exponentials with k as indicated. Note the nice agreement between the mean values of the analysis (•) and the values derived from the recordings of Fig. 6B (•).
Figure 5
Figure 5. Deactivation of T-type and HVA currents
A, deactivation kinetics of HVA currents at −50 mV and −110 mV in a cAMP-untreated cell. Test depolarization was to −10 mV. The two tails were fitted with single exponentials (black traces) with time constants 0.41 ms (−50 mV) and 0.25 ms (− 110 mV). B, deactivation kinetics of a T-type current recorded from a cAMP-treated cell. Test depolarization was to −30 mV. Tail currents were fitted with single exponentials with time constant 4.6 ms (−50 mV) and 1.08 ms (−110 mV). C, voltage dependence of deactivation derived from n = 8 cAMP-treated cells (•) and n = 8 cAMP-untreated cells (▴). Note the progressive increase in the rate of tail current decay with more negative repolarization. Continuous lines are single exponential functions with e-fold changes (k) as indicated.
Figure 6
Figure 6. Pharmacological isolation of cAMP-recruited T-type currents
A: top panel, examples of IV curves from cAMP-treated and cAMP-untreated cells preincubated with 3.2 μm ω-CTx-GVIA, 2 μm ω-Aga-IVA and bathed with 1 μm nifedipine. The two peaks at −22 mV and +12 mV in cAMP-treated cells (black trace) are associated with T-type and R-type channels, respectively. In cAMP-untreated cells only the IV curve associated to HVA R-type channels is evident (grey trace); middle and bottom panels, two representative recordings of Ca2+ currents at −30 and +20 mV from ω-toxin-treated RCCs, which were cAMP-treated or cAMP-untreated. Note the presence of the cAMP-recruited T-type channels which activate slowly and inactivate almost fully at the end of the −30 mV pulse, in contrast to the fast activating and slowly inactivating current at the same potential in cAMP-untreated cells. B, time course of T-type currents recorded from a cell incubated with 3.2 μm ω-CTx-GVIA, 2 μm ω-Aga-IVA, 1 μm SNX-482 (10 min) and bathed with 1 μm nifedipine in which HVA channels appeared fully blocked. Notice the crossing over of the currents between −50 and −10 mV (upper panel) and the nearly constant rate of inactivation above 0 mV (lower panel).
Figure 7
Figure 7. β-AR stimulation mimics the action of pCPT-cAMP
A, examples of IV curve and current recordings from an RCC exposed to 1 μm isoprenaline (ISO) since the first day of culture. The ionic conditions were similar to those of Fig. 1B. Note the strong similarities with Ca2+ current recordings obtained from cAMP-treated cells. The bottom right graph reports the percentage of RCCs expressing T-type currents at −30 mV after exposure to pCPT-cAMP, forskolin + IBMX and ISO. Numbers within the columns indicate the number of RCCs examined. B, IV curve and current traces at −20 mV and +20 mV from a cell expressing T-type currents following exposure to forskolin + IBMX.
Figure 8
Figure 8. T-type channel recruitment is unaffected by Rp-cAMPS and 8CPT-2Me-cAMP but prevented by anisomycin
A and B, examples of IV curves and Ca2+ currents in a cAMP-treated RCC incubated with either 200 μm pCPT-cAMP + 1 mm Rp-cAMPS or with 200 μm 8CPT-2Me-cAMP as indicated. Note the presence of transient T-type currents in both panels. C, examples of IV curve and current traces showing no sign of T-type channels in a cAMP-treated cell incubated with the protein synthesis inhibitor anisomycin (10 μm for 48 h). Note the voltage dependence of nifedipine-insensitive channels remaining available. D, percentages of RCCs expressing T-type currents at −30 or −20 mV after exposures to: pCPT-cAMP + 0.3 μm H89, pCPT-cAMP + Rp-cAMPS, 8CPT-2Me-cAMP and anisomycin. The numbers of RCCs tested are indicated inside the columns.
Figure 9
Figure 9. cAMP-recruited T-type channels modify the threshold of action potential firings in RCCs
A, action potential recordings from a cAMP-untreated (upper traces) and a cAMP-treated RCC (lower traces) during increasing current-clamp stimulations (5–20 pA). Cells were held at −60 mV by injecting 2–3 pA. Note that in the cAMP-treated cell, 5 pA was sufficient to elicit a spike, while in the cAMP-untreated cell 8 pA was required. B, mean time delay calculated from the start of the current pulse to the rise of the action potential for cAMP-treated (n = 6) and cAMP-untreated cells (n = 7). C, action potentials recorded on a time-expanded scale from cAMP-treated and cAMP-untreated RCCs showing the moderate broadening induced by cell exposure to pCPT-cAMP.
Figure 10
Figure 10. cAMP-recruited T-type channels modify the threshold of action potential firings in RCCs
Representative action potential recordings from cAMP-untreated (A) and cAMP-treated RCCs (B) under different Na+ and Ca2+ channel-blocking conditions. Cells were held at −90 mV to favour the contribution of T-type channels and were depolarized by current steps of 800 ms to the values indicated at the top of each column. The four rows of recordings refer, in order, to action potentials in Tyrode solution, in the presence of TTX, with TTX + nifedipine + ω-toxins and with Tris + nifedipine + ω-toxins (see text).

Similar articles

Cited by

References

    1. Albillos A, Artalejo AR, López MG, Gandía L, García AG, Carbone E. Ca2+ channel subtypes in cat chromaffin cells. J Physiol. 1994;477:197–213. - PMC - PubMed
    1. Albillos A, Neher E, Moser T. R-type Ca2+ channels are coupled to the rapid component of secretion in mouse adrenal slice chromaffin cells. J Neurosci. 2000;20:8323–8330. - PMC - PubMed
    1. Almers W, McCleskey EW. Non-selective conductance in calcium channels of frog muscle: calcium selectivity in a single file pore. J Physiol. 1984;353:585–608. - PMC - PubMed
    1. Armstrong CM, Matteson DR. Two distinct populations of calcium channels in a clonal line of pituitary cells. Science. 1985;227:65–67. - PubMed
    1. Artalejo CR, Adams ME, Fox AP. Three types of Ca2+ channel trigger secretion with different efficacies in chromaffin cells. Nature. 1994;367:72–76. - PubMed

Publication types

MeSH terms

LinkOut - more resources