

From The Cover: Diffusion-based method for producing density-equalizing maps
- PMID: 15136719
- PMCID: PMC419634
- DOI: 10.1073/pnas.0400280101
From The Cover: Diffusion-based method for producing density-equalizing maps
Abstract
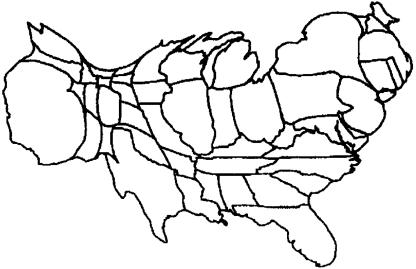
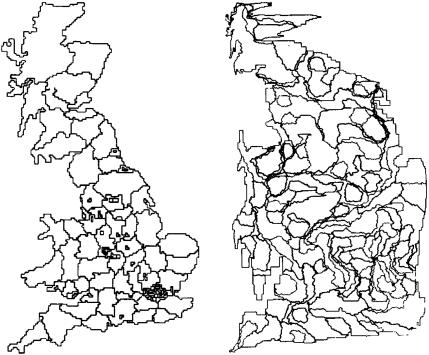
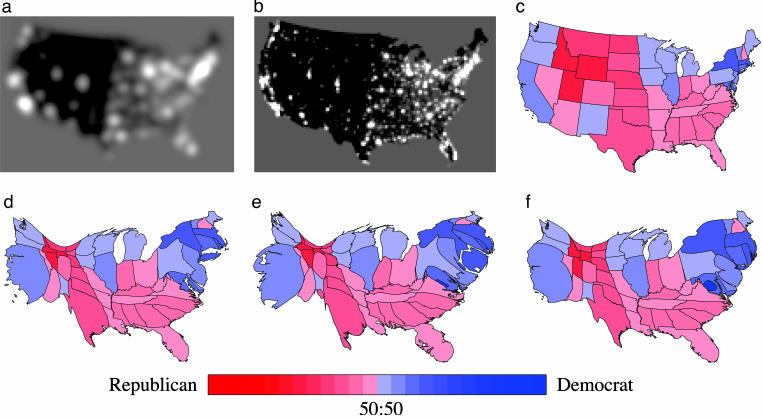
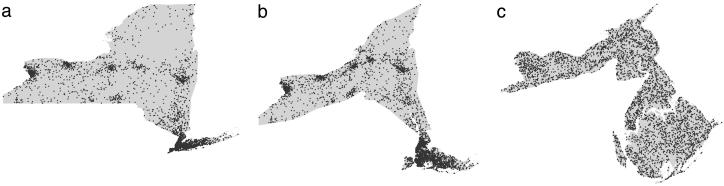
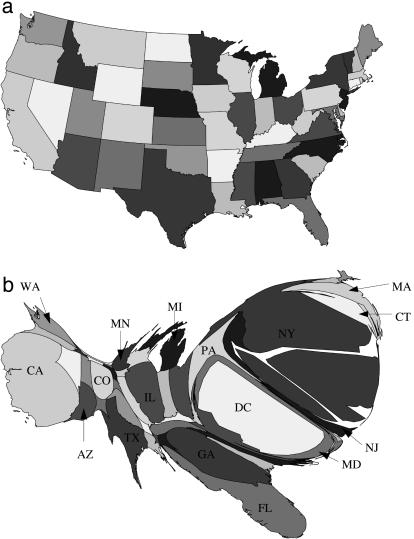
Map makers have for many years searched for a way to construct cartograms, maps in which the sizes of geographic regions such as countries or provinces appear in proportion to their population or some other analogous property. Such maps are invaluable for the representation of census results, election returns, disease incidence, and many other kinds of human data. Unfortunately, to scale regions and still have them fit together, one is normally forced to distort the regions' shapes, potentially resulting in maps that are difficult to read. Many methods for making cartograms have been proposed, some of them are extremely complex, but all suffer either from this lack of readability or from other pathologies, like overlapping regions or strong dependence on the choice of coordinate axes. Here, we present a technique based on ideas borrowed from elementary physics that suffers none of these drawbacks. Our method is conceptually simple and produces useful, elegant, and easily readable maps. We illustrate the method with applications to the results of the 2000 U.S. presidential election, lung cancer cases in the State of New York, and the geographical distribution of stories appearing in the news.
Figures
References
-
- Tobler, W. R. (1963) Geogr. Rev. 53, 59-78.
-
- Tobler, W. R. (1973) Ann. N.Y. Acad. Sci. 219, 215-220. - PubMed
-
- Dougenik, J. A., Chrisman, N. R. & Niemeyer, D. R. (1985) Prof. Geogr. 37, 75-81.
-
- Gusein-Zade, S. M. & Tikunov, V. S. (1993) Cartogr. Geogr. Inf. Syst. 20, 167-173.
-
- Appel, A., Evangelisti, C. J. & Stein, A. J. (1983) IBM Tech. Disclosure Bull. 26, 953-956.
Publication types
MeSH terms
LinkOut - more resources
Full Text Sources
Other Literature Sources
