. 2004 May 18;101(20):7805-8.
doi: 10.1073/pnas.0401077101. Epub 2004 May 10.

Frequent fusion and fission of plant mitochondria with unequal nucleoid distribution

Affiliations

Frequent fusion and fission of plant mitochondria with unequal nucleoid distribution

Shin-ichi Arimura et al. Proc Natl Acad Sci U S A. .

Abstract

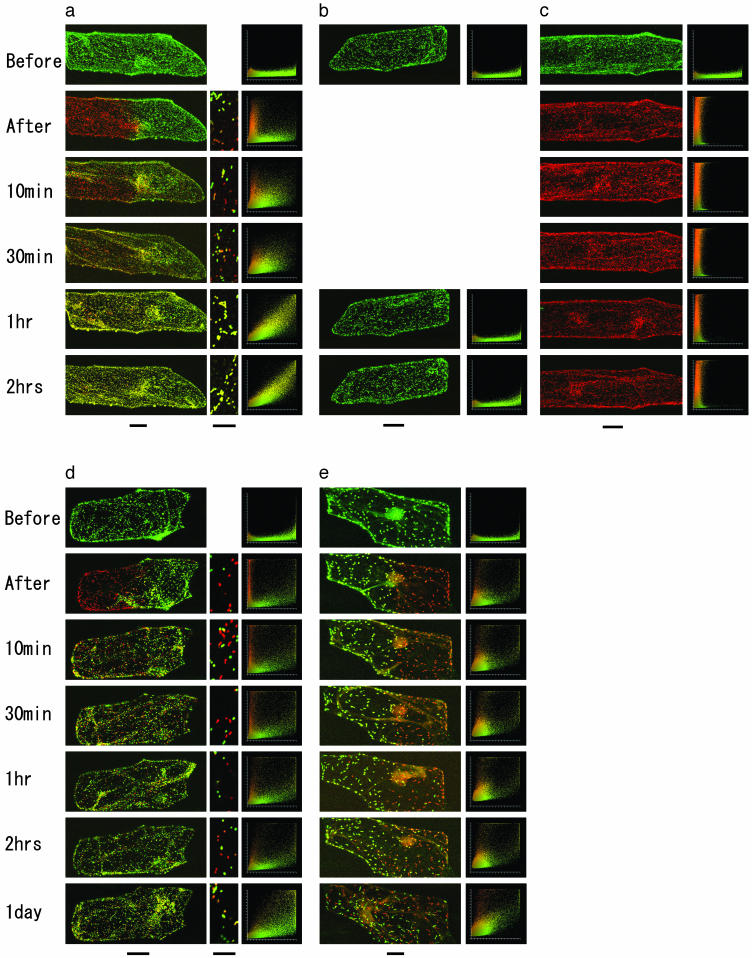
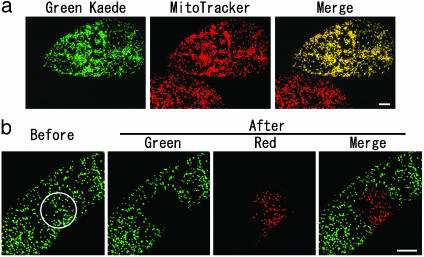
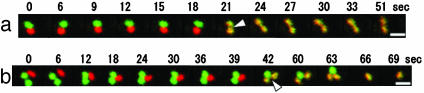
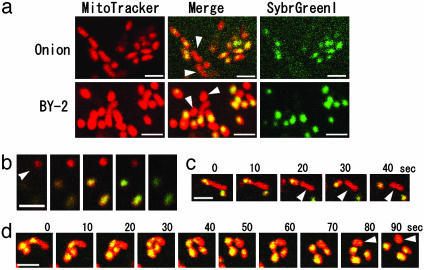
The balance between mitochondrial fusion and fission influences the reticular shape of mitochondria in yeasts. Little is known about whether mitochondria fusion occurs in plants. Plant mitochondria are usually more numerous and more grain-shaped than animal mitochondria. BLAST searches of the nuclear and mitochondrial genome sequences of Arabidopsis thaliana did not find any obvious homologue of mitochondrial fusion genes found in animals and yeasts. To determine whether mitochondrial fusion actually occurs in plants, we labeled mitochondria in onion epidermal cells with a mitochondria-targeted, photoconvertible fluorescent protein Kaede and then altered the fluorescence of some of the mitochondria within a cell from green to red. Frequent and transient fusion of red and green mitochondria was demonstrated by the appearance of yellow mitochondria that subsequently redivided. We also show that mitochondrial fission occasionally occurs without an equal distribution of the nucleoid (DNA-protein complex in mitochondria), resulting in the coexistence of mitochondria containing various amounts of DNA within a single cell. The heterogeneity of DNA contents in mitochondria may be overcome by the frequent and transient fusion of mitochondria.


Figures

Fig. 3.
Fig. 3.
Fusion of organelles in single onion bulb epidermal cells transformed with Kaede fusion proteins. (a) Mitochondria. (b) A non-UV-exposed control (mitochondria). (c) A whole-UV-exposed control (mitochondria). (d) Peroxisomes. (e) Plastids. A portion of each cell was exposed to UV to photoconvert some of the organelles to red. High-magnification images are also shown for mitochondria (a) and peroxisomes (d). In mitochondria, Kaede was completely redistributed within 2 h. Colocalization histograms plot each pixel according to its red intensity (y axis) and green intensity (x axis). Pixels with well colocalized red and green fluorescence appear as a narrow diagonal line. Scale bars (at the bottom of ae) indicate 50 μm for whole-cell images and 10 μm for high-magnification images.
Fig. 1.
Fig. 1.
Restricted photoconversion of Kaede with a mitochondrial presequence (Mt-Kaede) in a BY-2 cell. (a) Mitochondria were stained by MitoTracker. Native Kaede signals appear green. (Scale bar, 10 μm.) (b) Restricted photoconversion of Mt-Kaede in a BY-2 cell. The area in the white circle was irradiated with 380- to 420-nm wavelength light. (Scale bar, 10 μm.)
Fig. 2.
Fig. 2.
Mitochondrial fusion in onion bulb epidermal cells. (a) Mitochondrial fusion. (b) Mitochondrial fusion and fission. Time-course observations of red and green mitochondria. Images were acquired at 3-sec intervals, and representative ones are shown. Arrowheads indicate constrictions at the point of fusion. (Scale bars, 2 μm.) See Movie 1.
Fig. 4.
Fig. 4.
Mitochondria and mitochondrial nucleoids in tobacco suspension cultured cells (BY-2). (a) Mitochondria stained by MitoTracker (Left) and mitochondrial nucleoids stained by Sybr Green I (Right). In the merged images (Center), the nucleoids appear yellow because of the combination of red and green fluorescence. Arrowheads indicate mitochondria that have no visible nucleoids. (b) Views of three mitochondria at 0.5-μm intervals along the optical axis. Yellow nucleoids are visible in the lower two mitochondria but not in the top mitochondria. (c and d) Time series of fission of mitochondria with nucleoids shown at 10-sec intervals. (Scale bars, 2 μm.) Movies 2–4.

References

    1. Bereiter-Hahn, J. & Voth, M. (1994) Microsc. Res. Tech. 27, 198-219. - PubMed
    1. Nunnari, J., Marshall, W. F., Straight, A., Murray, A., Sedat, J. W. & Walter, P. (1997) Mol. Biol. Cell 8, 1233-1242. - PMC - PubMed
    1. Bleazard, W., McCaffery, J. M., King, E. J., Bale, S., Mozdy, A., Tieu, Q., Nunnari, J. & Shaw, J. M. (1999) Nat. Cell Biol. 1, 298-304. - PMC - PubMed
    1. Sesaki, H. & Jensen, R. E. (1999) J. Cell Biol. 147, 699-706. - PMC - PubMed
    1. Hales, K. G. & Fuller, M. T. (1997) Cell 90, 121-129. - PubMed

Publication types

Substances