. 2004 May 10;165(3):407-19.
doi: 10.1083/jcb.200308055.

The Abl-related gene (Arg) requires its F-actin-microtubule cross-linking activity to regulate lamellipodial dynamics during fibroblast adhesion

Affiliations

The Abl-related gene (Arg) requires its F-actin-microtubule cross-linking activity to regulate lamellipodial dynamics during fibroblast adhesion

Ann L Miller et al. J Cell Biol. .

Abstract

Microtubules (MTs) help establish and maintain cell polarity by promoting actin-dependent membrane protrusion at the leading edge of the cell, but the molecular mechanisms that mediate cross-talk between actin and MTs during this process are unclear. We demonstrate that the Abl-related gene (Arg) nonreceptor tyrosine kinase is required for dynamic lamellipodial protrusions after adhesion to fibronectin. arg-/- fibroblasts exhibit reduced lamellipodial dynamics as compared with wild-type fibroblasts, and this defect can be rescued by reexpression of an Arg-yellow fluorescent protein fusion. We show that Arg can bind MTs with high affinity and cross-link filamentous actin (F-actin) bundles and MTs in vitro. MTs concentrate and insert into Arg-induced F-actin-rich cell protrusions. Arg requires both its F-actin-binding domains and its MT-binding domain to rescue the defects in lamellipodial dynamics of arg-/- fibroblasts. These findings demonstrate that Arg can mediate physical contact between F-actin and MTs at the cell periphery and that this cross-linking activity is required for Arg to regulate lamellipodial dynamics in fibroblasts.


Figures

Figure 1.
Figure 1.
Arg promotes lamellipodial dynamics in adhering fibroblasts. (A–D) The leftmost panels are individual frames from time-lapse movies of (A) wild-type, (B) arg / , (C) arg / + YFP, (D) or arg / + Arg-YFP cells. For kymographic analysis, a radial grid of eight lines was centered on the nucleus of the phase-contrast images (as shown in the left panels of A–D). Kymographs illustrating the lamellipodial activity during the 10-min time-lapse movies were made at eight places around the edge of the cells (indicated by thick white bars). Examples of the kymographs generated for the cells in A–D are shown in the right three panels for each. Ascending edges (A, dotted black line) and descending edges (A, solid black line) indicate protrusion and retraction events. An example of a phase-dense membrane ruffle is indicated by the white arrowhead in A. Time is in the horizontal direction, and distance is in the vertical direction. Bars, 10 μm. (E) Frequencies of protrusions, retractions, and phase-dense membrane ruffles were quantified and averaged for arg / (n = 20) and wild-type cells (n = 24) at eight places around the cell periphery for each cell. The differences in frequencies of protrusion, retraction, and phase-dense ruffling between the wild-type and arg / cells were statistically significant by t test (**, P < 0.006; *, P < 0.05). (F) The same criteria were measured for YFP- expressing arg / cells (n = 25) and Arg-YFP– expressing arg / cells (n = 19) at eight places around the cell periphery for each cell. The differences in frequencies of protrusion, retraction, and phase-dense ruffling between the arg / + YFP and arg / + Arg-YFP cells were statistically significant by t test (***, P < 0.00001). Error bars represent mean ± SEM.
Figure 2.
Figure 2.
Arg-YFP is concentrated at sites of lamellipodial protrusion and phase-dense membrane ruffling. (A and B) Individual frames from time-lapse movies of arg / cells expressing YFP (A; Video 1) or Arg-YFP (B; Video 2). Phase-contrast images are on the left, and fluorescence images are on the right. (C) Enlargement of the region boxed in the top row of B showing a protrusive structure induced in the Arg-YFP–expressing cell (Video 3). Elapsed time, min:s. Bars, 10 μm.
Figure 3.
Figure 3.
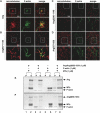
Arg binds MTs. (A–C) Cosedimentation of Arg or Arg mutants with MTs. (A) A fixed concentration of 0.25 μM Arg was mixed with increasing concentrations of MTs from 0 to 2 μM. The mixture was then pelleted by centrifugation, and equivalent amounts of the pellet (P) and supernatant (S) fractions were separated by SDS-PAGE followed by Coomassie blue staining. The amount of Arg or Arg mutants bound to MTs was quantified by densitometry. Three independent binding assays were repeated with 0.25 μM Arg and 0–8 μM MTs, and a plot of MT concentration (x axis) versus the amount Arg bound (y axis) is shown on the right. The dashed lines in A and B indicate places where two gels were spliced together. Lanes 1–4 are from one gel, and lanes 5–10 are from another gel. (B and C) 0.25 μM ArgΔC (B) or Arg557-1182 (C) was mixed with increasing concentrations of MTs from 0 to 2 μM and treated as described in A. A plot of MT concentration (x axis) versus the amount Arg mutant bound (y axis) is shown on the right.
Figure 4.
Figure 4.
Localization of the Arg MT-binding domain. (A and B) Cosedimentation of ArgΔ930-1140 (A) or Arg557-1140 (B) with MTs as described for Fig. 3 A. (C) Cosedimentation of GST-924-1090 with MTs. Because of the similar mobility of GST-924-1090 and MTs by SDS-PAGE, immunoblot analysis with anti-GST antibodies was performed to detect binding of GST-924-1090 to MTs. The amount of the Arg mutants bound to MTs in A–C was quantified by densitometry, and the resulting plots of MT concentration (x axis) versus the amount Arg mutant bound (y axis) are shown to the right of the cosedimentation gels. (D) Control demonstrating that GST alone does not bind to MTs.
Figure 5.
Figure 5.
Arg cross-links MTs and F-actin in vitro. (A–D) Purified Arg or Arg mutant proteins (0.5 μM) were mixed with rhodamine-labeled MTs (red; 1 μM). Alexa 488-phalloidin–labeled F-actin (green; 1 μM) was added to the mixture, samples were plated on glass coverslips, and were visualized by fluorescence microscopy. (A) Arg; (B) Arg557-1140; (C) ArgΔ930-1140; (D) Arg557-930. Enlargements of the boxed regions are shown in the panels directly below. Bars, 20 μm. (E and F) Cross-linking of Arg (E) or ArgΔ858-1034 (F), F-actin, and MTs by low speed sedimentation. 1 μM Arg (E) or ArgΔ858-1034 (F) was incubated with 1 μM MTs and 1 μM F-actin (lanes 7 and 8), and the mixture was pelleted by centrifugation at 5,000 g for 10 min to pellet F-actin bundles and F-actin cross-linked MTs. The pellet (P) and supernatant (S) fractions were separated by SDS-PAGE followed by Coomassie blue staining. As a control, (E) Arg or (F) ArgΔ858-1034 was mixed with MTs (lanes 1 and 2) or F-actin (lanes 3 and 4) and subjected to centrifugation, and MTs and F-actin (lanes 5 and 6) were mixed and subjected to centrifugation.
Figure 6.
Figure 6.
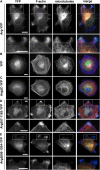
Arg-YFP mediates interactions between F-actin and MTs at the cell periphery. (A–E) arg / fibroblasts expressing Arg-YFP or Arg mutant-YFP fusions (green) were stained with anti-tubulin antibodies followed by Alexa 594–labeled secondary antibodies to visualize MTs (red) and with Alexa 350-phalloidin to visualize F-actin (blue). (A) arg / cells expressing Arg-YFP; panels in the second row are enlargements of the boxed regions in the first row, showing that the MT-rich protrusions induced in Arg-YFP–expressing cells colocalize with Arg-YFP concentrations and F-actin–rich structures. (B–E) arg / cells expressing YFP (B), ArgΔC-YFP (C), Arg557-1182-YFP (D), or ArgΔ858-1034-YFP (E). (D and E) Panels in the bottom row are enlargements of the boxed regions in the top row. Bars, 10 μm.
Figure 7.
Figure 7.
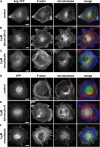
Arg concentration at the cell periphery requires intact F-actin and MTs. arg / fibroblasts expressing Arg-YFP (A–C; green) or YFP (D–F; green) were plated on fibronectin-coated coverslips and were treated with DMSO (drug vector control), latrunculin A, or nocodazole for 30 min. The cells were then fixed and stained for MTs (red) and F-actin (blue). Arg-YFP–expressing cells treated with (A) DMSO. Treatment with (B) 3 μM latrunculin A or (C) 5 μM nocodazole disrupted the Arg-YFP concentrations at the cell periphery. YFP-expressing cells treated with (D) DMSO, (E) 3 μM latrunculin A, or (F) 5 μM nocodazole. Bars, 10 μm.
Figure 8.
Figure 8.
The Arg COOH-terminal half requires its MT-binding domain to rescue defects in lamellipodial dynamics in a rg / cells. (A and B) The left two panels in A and B are individual frames from 10-min time-lapse movies of arg / fibroblasts expressing Arg557-1182-YFP, which contains the F-actin–binding domains and the MT-binding domain (A; Video 4), or ArgΔ858-1034-YFP, which contains both F-actin–binding domains but not the MT-binding domain (B; Video 5). Time elapsed min:s. Examples of kymographs at three of the eight positions around the cell periphery (indicated by thick white bars) for the cells in A and B are shown in the right three panels for each. Time is in the horizontal direction, and distance is in the vertical direction. Bars, 10 μm. (C) Frequencies of membrane protrusion, membrane retraction, and phase-dense membrane ruffles were quantified for arg / + YFP (n = 25), wild-type (n = 24), arg / + Arg557-1182-YFP (n = 23), and arg / + ArgΔ858-1034-YFP (n = 23) cells at eight places around the cell periphery for each cell. The differences in frequencies of protrusion, retraction, and ruffling between the arg / + YFP and arg / + Arg557-1182-YFP or arg / + ArgΔ858-1034-YFP cells were statistically significant by t test as indicated (*, P < 0.005; **, P < 0.0005; and ***, P < 0.00005). Error bars represent mean ± SEM.

Similar articles

Cited by

References

    1. Al-Bassam, J., R.S. Ozer, D. Safer, S. Halpain, and R.A. Milligan. 2002. MAP2 and tau bind longitudinally along the outer ridges of microtubule protofilaments. J. Cell Biol. 157:1187–1196. - PMC - PubMed
    1. Barth, A.I., K.A. Siemers, and W.J. Nelson. 2002. Dissecting interactions between EB1, microtubules and APC in cortical clusters at the plasma membrane. J. Cell Sci. 115:1583–1590. - PMC - PubMed
    1. Bashaw, G.J., T. Kidd, D. Murray, T. Pawson, and C.S. Goodman. 2000. Repulsive axon guidance: Abelson and Enabled play opposing roles downstream of the roundabout receptor. Cell. 101:703–715. - PubMed
    1. Bershadsky, A.D., E.A. Vaisberg, and J.M. Vasiliev. 1991. Pseudopodial activity at the active edge of migrating fibroblast is decreased after drug-induced microtubule depolymerization. Cell Motil. Cytoskeleton. 19:152–158. - PubMed
    1. Blanchoin, L., and T.D. Pollard. 1998. Interaction of actin monomers with Acanthamoeba actophorin (ADF/cofilin) and profilin. J. Biol. Chem. 273:25106–25111. - PubMed

Publication types

MeSH terms