. 2004 May;2(5):E128.
doi: 10.1371/journal.pbio.0020128. Epub 2004 May 11.

Ras and Gpa2 mediate one branch of a redundant glucose signaling pathway in yeast

Affiliations

Ras and Gpa2 mediate one branch of a redundant glucose signaling pathway in yeast

Ying Wang et al. PLoS Biol. 2004 May.

Abstract

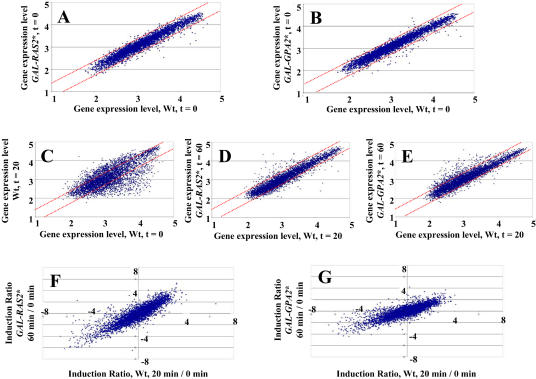
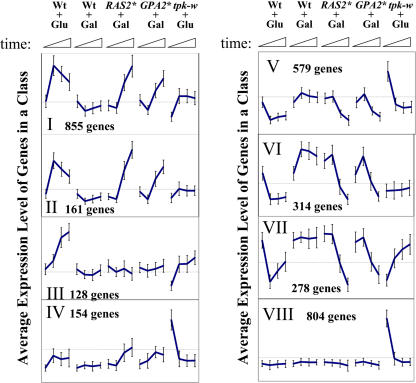
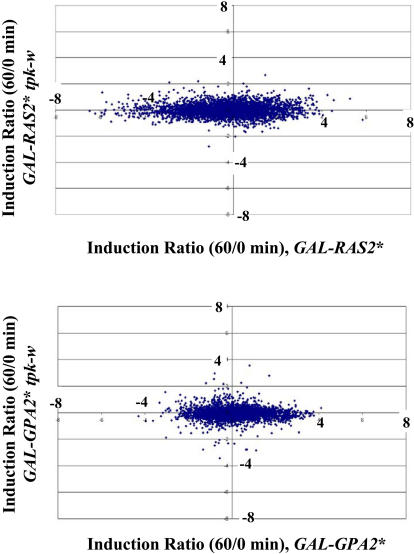
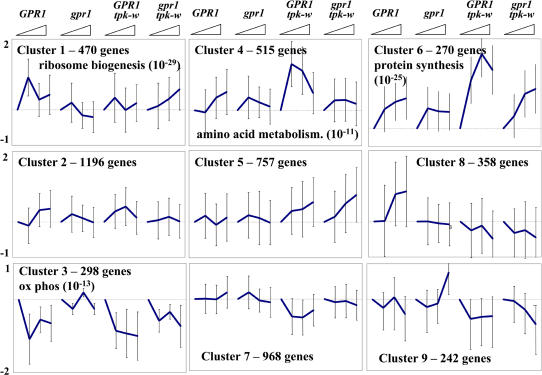
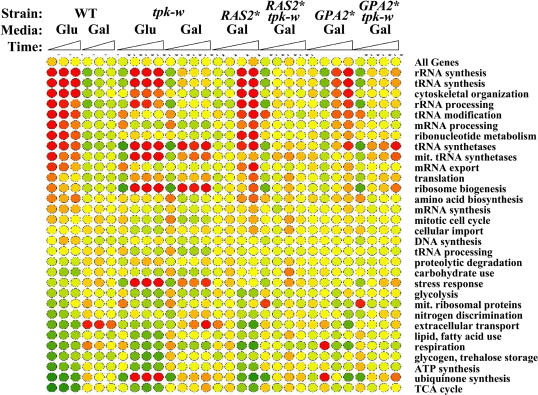
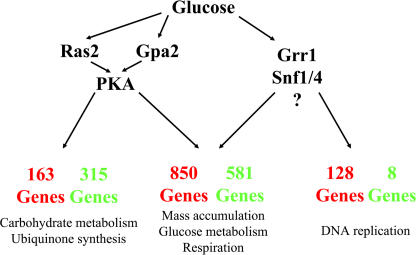
Addition of glucose to starved yeast cells elicits a dramatic restructuring of the transcriptional and metabolic state of the cell. While many components of the signaling network responsible for this response have been identified, a comprehensive view of this network is lacking. We have used global analysis of gene expression to assess the roles of the small GTP-binding proteins, Ras2 and Gpa2, in mediating the transcriptional response to glucose. We find that 90% of the transcriptional changes in the cell attendant on glucose addition are recapitulated by activation of Ras2 or Gpa2. In addition, we find that protein kinase A (PKA) mediates all of the Ras2 and Gpa2 transcriptional effects. However, we also find that most of the transcriptional effects of glucose addition to wild-type cells are retained in strains containing a PKA unresponsive to changes in cAMP levels. Thus, most glucose-responsive genes are regulated redundantly by a Ras/PKA-dependent pathway and by one or more PKA-independent pathways. Computational analysis extracted RRPE/PAC as the major response element for Ras and glucose regulation and revealed additional response elements mediating glucose and Ras regulation. These studies provide a paradigm for extracting the topology of signal transduction pathways from expression data.


Conflict of interest statement

The authors have declared that no conflicts of interest exist.

Figures

Figure 1
Figure 1. Glucose Stimulation and Ras2 or Gpa2 Activation Yield Similar Transcriptional Responses
(A–E) Expression levels (represented as absolute intensity values from Affymetrix hybridization scans) of individual yeast genes (points) plotted for two different strains and conditions. Dotted red lines indicate 2-fold difference boundary. (A) Strain Y2864 (Wt) prior to glucose addition versus Y2866 (GAL-RAS2*) prior to galactose addition. (B) Strain Y2864 prior to glucose addition versus Y2876 (GAL-GPA2*) prior to galactose addition. (C) Strain Y2864 20 min after glucose addition versus 0 min after addition. (D) Strain Y2866 60 min after galactose addition versus Y2864 20 min after glucose addition. (E) Strain Y2876 60 min after galactose addition versus Y2864 20 min after glucose addition. Values are in log10. (F and G) Induction ratios (mRNA level at 60 min/mRNA level at 0 min) of genes in Y2866 (F) and Y2876 (G) versus induction ratios (mRNA level at 20 min/mRNA level at 0 min) for the same genes in Y2864. Values are in log2.
Figure 2
Figure 2. Expression Patterns of Clustered Genes
Diagrams show the patterns of expression of genes in the classes (Roman numerals) listed in Table 1, which were clustered as described in Materials and Methods. Each line represents the average expression level of all genes in that cluster during the time course (20-min intervals over 1 h) in the strain and condition indicated. Absolute intensity values were normalized for each gene over all 32 conditions examined by subtracting the average expression level for that gene over the all conditions and dividing by the standard deviation for that gene. Thus, expression values (y-axis units) are represented as the standard deviations of each time point from the average expression value for each gene over the entire set of experiments. Error bars indicate the standard deviation in expression values of all genes in the cluster at the indicated timepoint. Abbreviations: Wt + Glu, glucose addition to strain Y2864; Wt + Gal, galactose addition to strain Y2864; RAS2* + Gal, galactose addition to strain Y2866; GPA2* + Gal, galactose addition to strain Y2876; tpk-w + Glu, glucose addition to strain Y2872.
Figure 3
Figure 3. Ras and Gpa2 Affect Transcription Exclusively through PKA
(Top) Induction ratios (mRNA level at 60 min/mRNA level at 0 min) of genes in strain Y2873 (y-axis) versus induction ratios (mRNA level at 60 min/mRNA level at 0 min) for the same genes in strain Y2866. Values are in log2. (Bottom) Similar analysis for strain Y2897 (y-axis) versus strain Y2876.
Figure 4
Figure 4. Loss of Gpr1 Diminishes the Glucose Response
Diagrams show the patterns of expression of genes in clusters based on time course changes (20-min intervals over 1 h) in gene expression following glucose addition to the indicated strains (GPR1, Y2092; gpr1, Y3159; GPR1 tpk-w, Y2857; gpr1 tpk-w, Y3077). For clustering, absolute intensity values were normalized for each gene over all 12 conditions examined by subtracting the average expression level for that gene over all conditions and dividing by the standard deviation for that gene, but the plotted expression values (y-axis units) represent the average of the absolute intensity of expression (converted to log2) of all the genes in the cluster at the indicated timepoint. Error bars indicate the standard deviation in expression values of all genes in the cluster at the indicated timepoint. The number of genes in each cluster and any highly enriched function group (including the p value) are indicated in each graph.
Figure 5
Figure 5. Functional Analysis of Glucose- and Ras-Induced Expression Changes
The average expression levels of genes grouped by the functional category listed on the right in the indicated strains over the 1-h time course are indicated by color (red, induced; green, repressed; yellow, unchanged). Values are relative to the expression level in strain Y2864 prior to glucose addition. The Functional Classification Catalog was obtained from MIPS at http://mips.gsf.de/proj/yeast/CYGD/db/index.html. Functional group analysis was performed using the ratio of vector magnitudes (Kuruvilla et al. 2002). The computer source code was derived from http://www-schreiber.chem.harvard.edu. Strains: Y2864 (WT), Y2872 (tpk-w), Y2866 (RAS2*), Y2873 (RAS2* tpk-w), Y2876 (GPA2*), Y2897 (GPA2* tpk-w).
Figure 6
Figure 6. The Role of Ras and Gpa2 in Glucose Regulation of Transcription
Diagram of information flow in glucose signal of transcription as deduced from global analysis of expression of genes in the strains used in this study. The number of genes regulated by each branch of the pathway, the nature of the regulation (red, induction; green, repression), and some of the functional categories of genes enriched in each branch are indicated.

Similar articles

Cited by

References

    1. Boy-Marcotte E, Perrot M, Bussereau F, Boucherie H, Jacquet M. Msn2p and Msn4p control a large number of genes induced at the diauxic transition which are repressed by cyclic AMP in Saccharomyces cerevisiae . J Bacteriol. 1998;180:1044–1052. - PMC - PubMed
    1. Broach JR, Deschenes RJ. The function of ras genes in Saccharomyces cerevisiae . Adv Cancer Res. 1990;54:79–139. - PubMed
    1. Cameron S, Levin L, Zoller M, Wigler M. cAMP-independent control of sporulation, glycogen metabolism, and heat shock resistance in S. cerevisiae . Cell. 1988;53:555–566. - PubMed
    1. Carlson M. Glucose repression in yeast. Curr Opin Microbiol. 1999;2:202–207. - PubMed
    1. Causton HC, Ren B, Koh SS, Harbison CT, Kanin E, et al. Remodeling of yeast genome expression in response to environmental changes. Mol Biol Cell. 2001;12:323–337. - PMC - PubMed

Publication types

MeSH terms