. 2004 May;2(5):E132.
doi: 10.1371/journal.pbio.0020132. Epub 2004 May 11.

A neutral model of transcriptome evolution

Affiliations

A neutral model of transcriptome evolution

Philipp Khaitovich et al. PLoS Biol. 2004 May.

Abstract

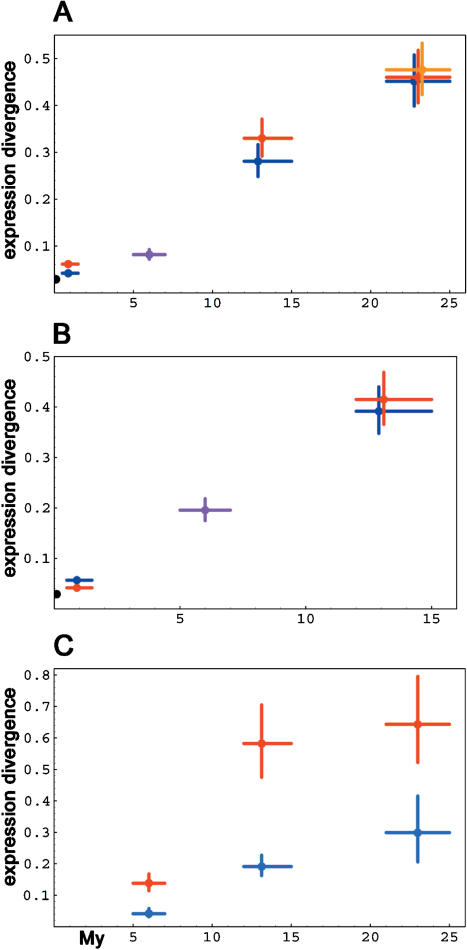
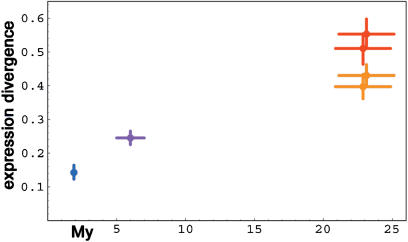
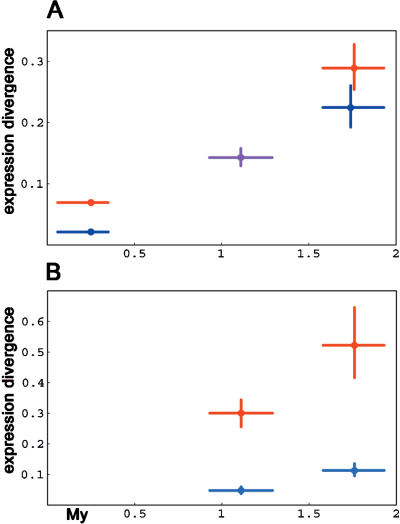
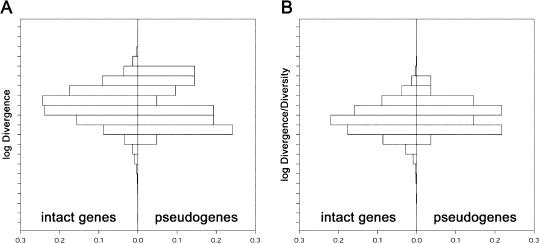
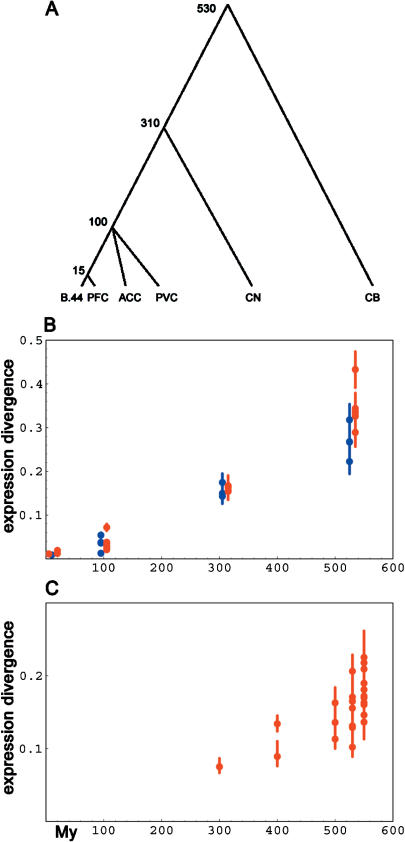
Microarray technologies allow the identification of large numbers of expression differences within and between species. Although environmental and physiological stimuli are clearly responsible for changes in the expression levels of many genes, it is not known whether the majority of changes of gene expression fixed during evolution between species and between various tissues within a species are caused by Darwinian selection or by stochastic processes. We find the following: (1) expression differences between species accumulate approximately linearly with time; (2) gene expression variation among individuals within a species correlates positively with expression divergence between species; (3) rates of expression divergence between species do not differ significantly between intact genes and expressed pseudogenes; (4) expression differences between brain regions within a species have accumulated approximately linearly with time since these regions emerged during evolution. These results suggest that the majority of expression differences observed between species are selectively neutral or nearly neutral and likely to be of little or no functional significance. Therefore, the identification of gene expression differences between species fixed by selection should be based on null hypotheses assuming functional neutrality. Furthermore, it may be possible to apply a molecular clock based on expression differences to infer the evolutionary history of tissues.


Conflict of interest statement

The authors have declared that no conflicts of interest exist.

Figures

Figure 1
Figure 1. Brain and Liver Transcriptome Change among Primates as a Function of Time
Average expression differences within and between primates in brains (A), in liver (B), and for genes in brain for genes with high (red) and low (blue) variation among six humans (C). Colors: red, comparisons between and with humans; blue, comparisons between and with chimpanzees; purple, comparisons between humans and chimpanzees; orange, comparisons between orangutan and rhesus macaque; black, comparisons between experimental duplicates. Vertical error bars for expression indicate 95% confidence intervals calculated by 10,000 bootstraps over genes. Divergence times are according to Glazko and Nei (2003).
Figure 2
Figure 2. Brain Transcriptome Change as Measured by cDNA Arrays
Colors and symbols as in Figure 1 except orange, which indicates comparisons between chimpanzee and both macaque species, and blue, which indicates comparisons between rhesus macaque and crab-eating macaque. Divergence times are according to Hayasaka et al. (1996) and Glazko and Nei (2003).
Figure 3
Figure 3. Brain Transcriptome Change among Mice as a Function of Time
Average expression differences within and between the mouse species (A) and for genes with high (red) and low (blue) variation among M. musculus individuals (B). Colors: red, comparisons between and with M. musculus; blue, between and with M. spretus; purple, between M. musculus and M. spretus. Vertical error bars for expression indicate 95% confidence intervals calculated by 10,000 bootstraps over genes. Divergence times are according to She et al. (1990).
Figure 4
Figure 4. Comparison between Intact Genes and Pseudogenes
(A) shows the distributions of expression divergence between humans and chimpanzees for intact genes and pseudogenes. (B) shows the distributions of the ratio of expression divergence between humans and chimpanzees and expression diversity within humans for intact genes and pseudogenes.
Figure 5
Figure 5. Transcriptome Change among Brain Regions as a Function of Evolutionary Time
(A) Schematic evolutionary tree for six human brain regions: B.44, Brodmann's area 44; PFC, prefrontal cortex; ACC, anterior cingulate cortex; PVC, primary visual cortex; CN, caudate nucleus; and CB, cerebellum. Numbers indicate approximate divergence time in millions of years (Butler and Hodos 1996; Nieuwenhuys et al. 1998). (B) Average expression differences among brain regions in humans (red) and in chimpanzees (blue). (C) Average expression differences among brain regions in M. musculus. Error bars for expression indicate 95% confidence intervals calculated from 10,000 bootstrap replications over genes.

References

    1. [Anonymous] Human Unigeneset-RZPD3 microarray—A microarray representing 51K human unigene clusters. Available: http://embl-h3r.embl.de via the Internet. 2003 Accessed 11 February 2004.
    1. Bolstad BM, Irizarry RA, Astrand M, Speed TP. A comparison of normalization methods for high density oligonucleotide array data based on variance and bias. Bioinformatics. 2003;19:185–193. - PubMed
    1. Butler AB, Hodos W. New York: John Wiley and Sons; 1996. Comparative vertebrate neuroanatomy: Evolution and adaptation; 514 pp.
    1. Caceres M, Lachuer J, Zapala MA, Redmond JC, Kudo L, et al. Elevated gene expression levels distinguish human from non-human primate brains. Proc Natl Acad Sci U S A. 2003;100:13030–13035. - PMC - PubMed
    1. Charlesworth B. Some quantitative methods for studying evolutionary patterns in single characters. Paleobiology. 1984;10:308–318.

Publication types