Comparative Study
. 2004 May;25(5):746-55.

Comparison of cerebral blood volume and vascular permeability from dynamic susceptibility contrast-enhanced perfusion MR imaging with glioma grade

Affiliations
Comparative Study

Comparison of cerebral blood volume and vascular permeability from dynamic susceptibility contrast-enhanced perfusion MR imaging with glioma grade

Meng Law et al. AJNR Am J Neuroradiol. 2004 May.

Abstract

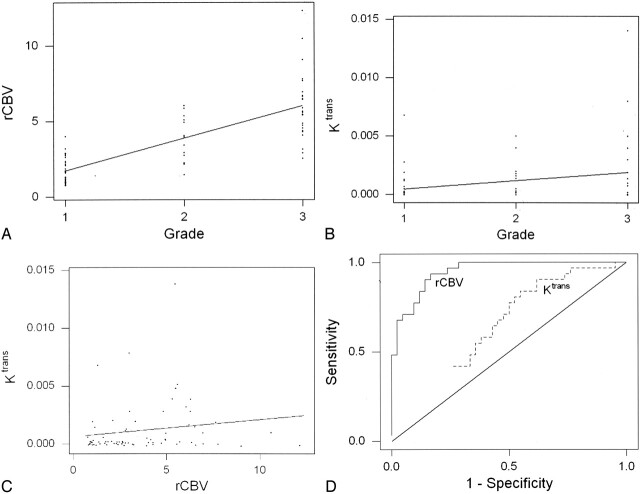
Background and purpose: Relative cerebral blood volume (rCBV) and vascular permeability (K(trans)) permit in vivo assessment of glioma microvasculature. We assessed the associations between rCBV and K(trans) derived from dynamic, susceptibility-weighted, contrast-enhanced (DSC) MR imaging and tumor grade and between rCBV and K(trans).

Methods: Seventy-three patients with primary gliomas underwent conventional and DSC MR imaging. rCBVs were obtained from regions of maximal abnormality for each lesion on rCBV color maps. K(trans) was derived from a pharmacokinetic modeling algorithm. Histopathologic grade was compared with rCBV and K(trans) (Tukey honestly significant difference). Spearman and Pearson correlation factors were determined between rCBV, K(trans), and tumor grade. The diagnostic utility of rCBV and K(trans) in discriminating grade II or III tumors from grade I tumors was assessed by logistic regression.

Results: rCBV was significantly different for all three grades (P </=.0005). K(trans) was significantly different between grade I and grade II or III (P =.027) but not between other grades or combinations of grades. Spearman rank and Pearson correlations, respectively, were as follows: rCBV and grade, r = 0.817 and r = 0.771; K(trans) and grade, r = 0.234 and r = 0.277; and rCBV and K(trans), r = 0.266 and r = 0.163. Only rCBV was significantly predictive of high-grade gliomas (P <.0001).

Conclusion: rCBV with strongly correlated with tumor grade; the correlation between K(trans) and tumor grade was weaker. rCBV and K(trans) were positively but weakly correlated, suggesting that these parameters demonstrate different tumor characteristics. rCBV is a more significant predictor of high-grade glioma than K(trans).


Figures

F<sc>ig</sc> 1.
Fig 1.
Correlation analysis of rCBV, K trans, and glioma grade. A, rCBV and glioma grade were strongly correlated, with Spearman r = 0.817 (P = .0001) and Pearson r = 0.771 (P = .0004). The slope and its gradient are consistent with a strong positive correlation with highly significant P values. B, A weaker correlation was observed between K trans and glioma grade: Spearman r = 0.234 (P = .046) and Pearson r = 0.277 (P = .017). Although the slope indicates a positive correlation, its gradient is less pronounced, with less significant P values than in A. Furthermore, more overlap is noted in K trans measurements than in the rCBV measurements in A. C, Relationship between rCBV and Ktrans is characterized by a modest yet statistically significant Spearman rank correlation (r = 0.266; P = .023) and a weak, statistically insignificant Pearson product moment correlation (r = 0.163; P = .168). D, Receiver operating characteristic curves for rCBV and Ktrans, as estimated from logistic regression. rCBV was a significant predictor of high-grade gliomas with higher sensitivity and specificity than Ktrans.
F<sc>ig</sc> 2.
Fig 2.
Low-grade astrocytoma (grade I/III). A, T2-weighted image (3158/119) demonstrates bifrontal abnormalities in signal intensity centered primarily in the left frontal lobe. B, Contrast-enhanced T1-weighted image (600/14/1) demonstrates an ill-defined focus of enhancement. C, rCBV map demonstrates a few foci of mildly elevated perfusion (arrow), which are in a location different from the region of maximal enhancement in B. D, SD25 color map suggests low permeability throughout the lesion.
F<sc>ig</sc> 3.
Fig 3.
Anaplastic astrocytoma (grade II/III). A, Proton density–weighted image (3158/17) demonstrates heterogeneous, left-sided paraventricular lesion extending into the left lateral ventricle. There is a small amount of vasogenic edema. B, Contrast-enhanced T1-weighted image (600/14/1) demonstrates a small focus of peripheral enhancement. C, rCBV map demonstrates elevated perfusion. On this occasion, the finding corresponds to the enhancing focus in B. D, SD25 color map suggests intermediate permeability in the solid portions of this tumor.
F<sc>ig</sc> 4.
Fig 4.
GBM (grade III/III). A, T2-weighted image (3158/119/1) demonstrates a left parietal lesion with mass effect, edema, and signal-intensity heterogeneity. These are features of a high-grade glioma, such as a GBM. B, Contrast-enhanced T1-weighted (600/14/1) with extensive, heterogeneous contrast enhancement. C, rCBV map shows markedly elevated perfusion. D, SD25 color map suggests markedly elevated permeability. Note that the areas of highest rCBV elevation do not directly correspond to the regions of highest SD25 (arrow).
F<sc>ig</sc> 5.
Fig 5.
Typical normalized signal-intensity curves for the three glioma grades studied. Grade I glioma demonstrates a shallow perfusion signal-intensity curve with SD25 after the bolus peak; this was relatively close to the prebolus baseline, suggesting relatively low permeability. Grade II glioma demonstrates a more substantial initial signal intensity drop, indicating higher rCBV with slower return to baseline. SD25 is considerably larger than that seen in grade I gliomas. Grade III glioma shows a larger area above the curve, indicating high rCBV with a similarly delayed return to baseline; this suggests high permeability.

Comment in

References

    1. Daumas-Duport C, Scheithauer B, O’Fallon J, Kelly P. Grading of astrocytomas: a simple and reproducible method. Cancer 1988;62:2152–2165 - PubMed
    1. Christoforidis GA, Bourekas EC, Baujan M, et al. High resolution MRI of the deep brain vascular anatomy at 8 tesla: susceptibility-based enhancement of the venous structures. J Comput Assist Tomogr 1999;23:857–866 - PubMed
    1. Christoforidis GA, Grecula JC, Newton HB, et al. Visualization of microvascularity in glioblastoma multiforme with 8-T high-spatial-resolution MR imaging. AJNR Am J Neuroradiol 2002;23:1553–1556 - PMC - PubMed
    1. Burger P. Malignant astrocytic neoplasms: classification, pathology, anatomy, and response to therapy. Semin Oncol 1986;13:16–20 - PubMed
    1. Aronen HJ, Gazit IE, Louis DN, et al. Cerebral blood volume maps of gliomas: comparison with tumor grade and histologic findings. Radiology 1994;191:41–51 - PubMed

Publication types

MeSH terms