. 2004 May 12;24(19):4635-48.
doi: 10.1523/JNEUROSCI.5631-03.2004.

Targeted deletion of the kynurenine aminotransferase ii gene reveals a critical role of endogenous kynurenic acid in the regulation of synaptic transmission via alpha7 nicotinic receptors in the hippocampus

Affiliations

Targeted deletion of the kynurenine aminotransferase ii gene reveals a critical role of endogenous kynurenic acid in the regulation of synaptic transmission via alpha7 nicotinic receptors in the hippocampus

Manickavasagon Alkondon et al. J Neurosci. .

Abstract

It has been postulated that endogenous kynurenic acid (KYNA) modulates alpha7* nicotinic acetylcholine receptor (nAChR) and NMDA receptor activities in the brain.a To test this hypothesis, alpha7* nAChR and NMDA receptor functions were studied in mice with a targeted null mutation in the gene encoding kynurenine aminotransferase II (mKat-2-/- mice), an enzyme responsible for brain KYNA synthesis. At 21 postnatal days, mKat-2-/- mice had lower hippocampal KYNA levels and higher spontaneous locomotor activity than wild-type (WT) mice. At this age, alpha7* nAChR activity induced by exogenous application of agonists to CA1 stratum radiatum interneurons was approximately 65% higher in mKat-2-/- than WT mice. Binding studies indicated that the enhanced receptor activity may not have resulted from an increase in alpha7* nAChR number. In 21-d-old mKat-2-/- mice, endogenous alpha7* nAChR activity in the hippocampus was also increased, leading to an enhancement of GABAergic activity impinging onto CA1 pyramidal neurons that could be reduced significantly by acute exposure to KYNA (100 nM). The activities of GABA(A) and NMDA receptors in the interneurons and of alpha3beta4* nAChRs regulating glutamate release onto these neurons were comparable between mKat-2-/- and WT mice. By 60 d of age, KYNA levels and GABAergic transmission in the hippocampus and locomotor activity were similar between mKat-2-/- and WT mice. Our findings that alpha7* nAChRs are major targets for KYNA in the brain may provide insights into the pathophysiology of schizophrenia and Alzheimer's disease, disorders in which brain KYNA levels are increased and alpha7* nAChR functions are impaired.


Figures

Figure 1.
Figure 1.
Genotypic characterization of mKat-2-/- mice. A, Schematic representation of the targeting and PCR strategy used for generating and genotyping mKat-2-/- mice. B, Genotype of the mice was verified by PCR using two pairs of primers as indicated in A (see also Materials and Methods). Expected PCR products for WT and mKat-2-/- mice are 1.7 and 1.4 kb, respectively. The restriction enzyme cleavage sites are indicated with H (HindIII), B (BamHI), and K (KpnI). C, Northern blot analysis using full-length mKat-2 cDNA as probe demonstrated loss of mKat-2 transcripts in mKat-2-/- mice. The amount of total RNA loaded on each lane was indicated by the 18 S ribosomal RNA. D, Immunotitration of KAT activity in hippocampal extracts from WT and mKat-2-/- mice at 21 and 60 d of age. At postnatal days 21 and 60, a rabbit anti-human KAT II antibody was used to immunoprecipitate KAT II in hippocampal extracts from WT and mKat-2-/- mice. Total KAT activity (control) in each animal group was compared with the corresponding KAT activity measured in the presence of the anti-KAT II antibody. Graph and error bars represent mean and SEM, respectively, of results obtained from three animals per experimental group. *p < 0.05 by two-way ANOVA.
Figure 2.
Figure 2.
Phenotypic characterization of 21- and 60-d-old mice with disrupted mKat-2 expression. Graphs show levels of kynurenine (A), quinolinic acid (B), and KYNA (C) in the hipppocampi of WT and mKat-2-/- mice at 21 and 60 d of age. Graph and error bars represent mean and SEM, respectively, of results obtained from five to nine animals in each group. D, Locomotor activity of 21- and 60-d-old WT and mKat-2-/- mice was analyzed in a mouse Tru Scan Activity Monitor (Coulbourn Instruments, Allentown, PA) according to the procedure described in Material and Methods. Graph and error bars are the mean and SEM, respectively, of results obtained from 17 WT and 18 mKat-2-/- mice. The same WT and mKat-2-/- mice were tested across ages. *p < 0.05 by two-way ANOVA, followed by Bonferroni post hoc test.
Figure 3.
Figure 3.
Pharmacological characterization of somatodendritic nAChRs present in CA1 SR interneurons of WT and mKat-2-/- mice. A, Sample recordings of whole-cell currents evoked by U-tube application of choline (10 mm) to a CA1 SR interneuron at -68 mV under control condition (top trace), in the presence ofα-BGT (50 nm) after 10 min exposure of the hippocampal slice to the toxin (middle trace), and after 20 min of washing the preparation withα-BGT-free ACSF (bottom trace). B, Sample recordings of choline-evoked whole-cell currents obtained from another CA1 SR interneuron at -68 mV before (top trace), during (middle trace), and after exposure of the hippocampal slice to MLA (10 nm). Exposure to MLA lasted 8-10 min, and the washing phase lasted 20 min. C, Sample recordings obtained from a CA1 SR interneuron under cell-attached configuration using a nominally Mg2+-free ACSF. U-tube application of choline to this neuron triggered action potentials that were recorded as fast-current transients and could not be detected after 5 min exposure of the hippocampal slice to TTX (100 nm). After a 5 min wash of the slice with TTX-free ACSF, choline (10 mm) or ACh (0.1 mm) triggered action potentials in the same neuron. The longer onset of the response and the smaller number of action potentials seen with ACh than with choline can be attributed to the difference in the concentration of the agonists. The pipette potential was -60 mV. D, Sample recordings of slowly decaying whole-cell currents triggered by U-tube application of ACh (1 μm to 1 mm) to a CA1 SR interneuron at -68 mV. In all experiments, ACSF contained atropine (1 μm) and bicuculline (10 μm). Samples shown in this figure were obtained from CA1 SR interneurons of 21-d-old mKat-2-/- mice and are qualitatively representative of results obtained from hippocampal slices of WT and mKat-2-/- mice.
Figure 4.
Figure 4.
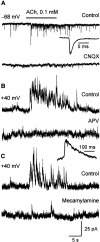
Pharmacological characterization of nAChRs that modulate glutamate release onto CA1 SR interneurons of WT and mKat-2-/- mice. A, Sample recordings of ACh (0.1 mm)-triggered EPSCs obtained from a CA1 SR interneuron at -68 mV before (top trace) and after (bottom trace) 8-10 min of perfusion of the hippocampal slice with CNQX (10 μm)-containing ACSF. The average of the ACh-triggered EPSCs is shown in an expanded scale that reveals the fast decaying kinetics characteristic of AMPA EPSCs. B, Sample recordings of ACh-evoked EPSCs obtained from the same interneuron at +40 mV before (top trace) and after (bottom trace) 8-10 min of perfusion of the hippocampal slice with APV (50 μm)-containing ACSF. The averaged ACh-triggered EPSCs shown in an expanded scale reveals the slow decaying kinetics that characterizes glutamatergic events mediated by NMDA receptors. C, Sample recordings of ACh-triggered EPSCs obtained from the same interneuron at +40 mV before (top trace) and after (bottom trace) 10 min of perfusion of the hippocampal slice with ACSF containing mecamylamine (1 μm). In the presence of mecamylamine (1 μm), ACh was unable to trigger EPSCs in the interneuron held at +40 mV. All recordings were obtained using ACSF containing Mg2+ (1 mm), atropine (1 μm), and bicuculline (10 μm). Samples shown in this figure were obtained from a CA1 SR interneuron of a 21-d-old WT mouse and are qualitatively representative of results obtained from hippocampal slices of WT and mKat-2-/- mice.
Figure 5.
Figure 5.
Quantification ofα7* nAChR-mediated whole-cell currents recorded from CA1 SR interneurons in hippocampal slices of 21-d-old WT and mKat-2-/- mice. A, Sample recordings of whole-cell currents evoked by application of choline to CA1 SR interneurons at -68 mV in hippocampal slices from WT and mKat-2-/- mice. Two representative samples in each group are shown. ACSF contained Mg2+ (1 mm), atropine (1 μm), and bicuculline (10 μm). B, Top graph summarizes the mean ± SEM values of peak amplitude and net charge of choline-evoked currents in interneurons from WT and mKat-2-/- mice. Numbers of neurons studied in each animal group are shown in parentheses. The number of neurons included in the analysis of net charge was in general lower than the number of neurons included in the analysis of the peak current amplitude attributable to contamination of the recordings with glutamatergic synaptic events. Statistical significance was determined using the unpaired Student's t test. The bottom graph shows the distribution of individual values of peak amplitude and net charge of choline-evoked currents in the two animal groups.
Figure 6.
Figure 6.
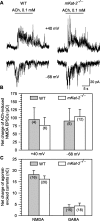
Quantification of α3β4* nAChR-mediated responses and NMDA plus glycine- or GABA-evoked whole-cell currents recorded from CA1 SR interneurons in hippocampal slices of 21-d-old WT and mKat-2-/- mice. A, Sample recordings of ACh-evoked NMDA EPSCs obtained at +40 or -68 mV from CA1 SR interneurons of hippocampal slices from WT and mKat-2-/- mice. ACSF contained atropine (1 μm) and bicuculline (10 μm). Responses at +40 mV were recorded using Mg2+-containing ACSF, whereas those at -68 mV were recorded using nominally Mg2+-free ACSF. B, Quantification of the net charge of ACh-evoked NMDA EPSCs at the different membrane potentials in both animal groups. Numbers of neurons studied are shown in parentheses. Graph and error bars are the mean and SEM, respectively, of results obtained from the various neurons. Results obtained from WT and mKat-2-/- mice were not significantly different (unpaired Student's t test). C, Quantitative analysis of the net charge carried by whole-cell currents evoked by GABA (20 μm) or NMDA (50 μm) plus glycine (10 μm) in CA1 SR interneurons of hippocampal slices from WT and mKat-2-/- mice. Membrane potential, -68 mV. NMDA-evoked currents were recorded using Mg2+-free ACSF; GABA-evoked currents were recorded in the presence of TTX (200 nm) and using a CsCl-containing pipette solution. The net charge of agonist-evoked whole-cell currents was analyzed in both animal groups. Numbers of neurons studied are shown in parentheses. Graph and error bars are the mean and SEM, respectively, of results obtained from the various neurons. According to the unpaired Student's t test, results obtained from WT and mKat-2-/- mice were not significantly different.
Figure 7.
Figure 7.
Representative sample recordings of spontaneously occurring IPSCs obtained from CA1 pyramidal neurons of 21-d-old WT and mKat-2-/- mice. Top traces in A and B show continuous 5 min recordings of IPSCs obtained from CA1 pyramidal neurons voltage clamped at 0 mV in hippocampal slices from a 21-d-old WT mouse (A) and a 21-d-old mKat-2-/- mouse. For better visualization of the individual IPSCs, middle and bottom traces in A and B show, at expanded time scales, episodes from the same recordings displayed on top. ACSF contained 1 mm Mg2+, and the methanesulfonate-based internal solution was used to fill up the pipettes.
Figure 8.
Figure 8.
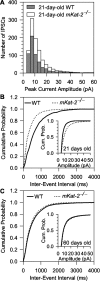
Analysis of spontaneously occurring IPSCs recorded from CA1 pyramidal neurons in hippocampal slices of WT and mKat-2-/- at 21 or 60 d of age. A, Superimposed histogram distributions of peak amplitudes of IPSCs recorded from CA1 pyramidal neurons of 21-d-old WT and mKat-2-/- mice. IPSCs were recorded for 5 min from each neuron studied at 0 mV using Mg2+-containing ACSF and Cs methanesulfonate-based internal solution. The bin width in the histograms is 3 pA. Results are the average of the histogram distributions obtained from seven neurons in hippocampal slices from four WT mice and six neurons in hippocampal slices from three mKat-2-/- mice. B, Cumulative probability plots of interevent intervals and peak amplitude (inset) of IPSCs recorded under the same conditions as those described in A from CA1 pyramidal neurons in hippocampal slices of 21-d-old WT and mKat-2-/- mice. Plots are averages of cumulative probability plots obtained from seven neurons in hippocampal slices from four WT mice and six neurons in hippocampal slices from three mKat-2-/- mice. Results obtained from mKat-2-/- and WT mice were significantly different according to the K-S test (p < 0.001 for differences in the cumulative plots of interevent intervals, and p = 0.002 for cumulative plots of amplitudes). C, Cumulative probability plots of interevent intervals and peak amplitudes (inset) of IPSCs recorded under the same conditions as those described in A from CA1 pyramidal neurons in hippocampal slices of 60-d-old WT and mKat-2-/- mice. Plots are averages of cumulative probability plots obtained from nine neurons in hippocampal slices from four WT mice and eight neurons in hippocampal slices from four mKat-2-/- mice. According to the K-S test, results obtained from mKat-2-/- and WT mice were not significantly different.
Figure 9.
Figure 9.
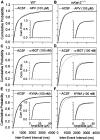
Effects of the NMDA receptor antagonist APV and of the α7* nAChR antagonist α-BGT on spontaneously occurring IPSCs recorded from CA1 pyramidal neurons in hippocampal slices of 21-d-old WT and mKat-2-/- mice. A, B, Cumulative probability plots of interevent intervals and peak amplitudes of IPSCs recorded at 0 mV from CA1 pyramidal neurons of WT mice (A) or mKat-2-/- mice for 5 min before and during 5 min exposure of the hippocampal slices to the NMDA receptor antagonist APV (100 μm). Plots are averages of cumulative probability plots obtained from four neurons in hippocampal slices from three WT mice and four neurons in hippocampal slices from three mKat-2-/- mice. According to the K-S test, APV did not affect the results obtained in each animal group. C, D, Cumulative probability plots of interevent intervals and peak amplitudes of IPSCs recorded at 0 mV from CA1 pyramidal neurons of WT mice (C) or mKat-2-/- mice (D) for 5 min before and for 5 min after a 10 min perfusion of the hippocampal slices with ACSF containingα-BGT (100 nm). Plots are averages of cumulative probability plots obtained from six neurons in hippocampal slices from four WT mice and seven neurons in hippocampal slices from three mKat-2-/- mice. According to the K-S test, the results obtained from WT neurons in the absence and in the presence ofα-BGT did not differ significantly. However, the results obtained from mKat-2-/- neurons in the presence of α-BGT were significantly different from those obtained in the absence of the toxin (p < 0.001 for differences in both cumulative plots). E, F, Cumulative probability plots of interevent intervals and peak amplitudes of IPSCs recorded at 0 mV from CA1 pyramidal neurons of WT mice (E) or mKat-2-/- mice (F) under control conditions (ACSF) or 1 hr after exposure of the hippocampal slices to ACSF containing KYNA (100 nm). Graphs are averages of cumulative probability plots obtained from six neurons in hippocampal slices from four WT mice and seven neurons in hippocampal slices from three mKat-2-/- mice. According to the K-Stest, the results obtained from WT neurons in the absence and in the presence of KYNA did not differ significantly. However, the cumulative plots of interevent intervals obtained from mKat-2-/- neurons in the presence of KYNA were significantly different from those obtained in the absence of the metabolite (p < 0.05). KYNA also caused a small left shift that came close to the level of significance (p = 0.06 according to the K-S test) in the cumulative plot of amplitudes of IPSCs recorded from the mutant neurons.
Figure 10.
Figure 10.
Morphological analysis of CA1 SR interneurons from which recordings were obtained and correlational analysis of dendritic length and amplitude of choline-evoked whole-cell currents. A, Neurolucida drawings of biocytin-filled CA1 SR interneurons studied electrophysiologically in hippocampal slices of 21-d-old WT and mKat-2-/- mice. One representative sample of each animal group is shown. Dendrites are represented as thick black lines, and axons are represented as thin gray lines. B, Quantitative analysis of the dendritic length of CA1 SR interneurons of WT and mKat-2-/- mice. Graph and error bars are the mean and SEM, respectively, of results obtained from 11 neurons of WT mice and 13 neurons of mKat-2-/- mice. C, Analysis of correlation between the amplitude of choline-evoked whole-cell currents and the dendritic length of that neuron. The straight line represents the linear regression of the points, and r2 is the regression coefficient.

Similar articles

Cited by

References

    1. Adams CE, Broide RS, Chen Y, Winzer-Serhan UH, Henderson TA, Leslie FM, Freedman R (2002) Development of the alpha7 nicotinic cholinergic receptor in rat hippocampal formation. Brain Res Dev Brain Res 139: 175-187. - PubMed
    1. Albuquerque EX, Alkondon M, Pereira EFR, Castro NG, Schrattenholz A, Barbosa CTF, Bonfante-Cabarcas R, Aracava Y, Eisenberg HM, Maelicke A (1997) Properties of neuronal nicotinic acetylcholine receptors: pharmacological characterization and modulation of synaptic function. J Pharmacol Exp Ther 280: 1117-1136. - PubMed
    1. Alkondon M, Albuquerque EX (2001) Nicotinic acetylcholine receptor alpha7 and alpha4beta2 subtypes differentially control GABAergic input to CA1 neurons in rat hippocampus. J Neurophysiol 86: 3043-3055. - PubMed
    1. Alkondon M, Albuquerque EX (2002) A non-alpha7 nicotinic acetylcholine receptor modulates excitatory input to hippocampal CA1 interneurons. J Neurophysiol 87: 1651-1654. - PubMed
    1. Alkondon M, Pereira EFR, Eisenberg HM, Albuquerque EX (1999) Choline and selective antagonists identify two subtypes of nicotinic acetylcholine receptors that modulate GABA release from CA1 interneurons in rat hippocampal slices. J Neurosci 19: 2693-2705. - PMC - PubMed

Publication types

MeSH terms